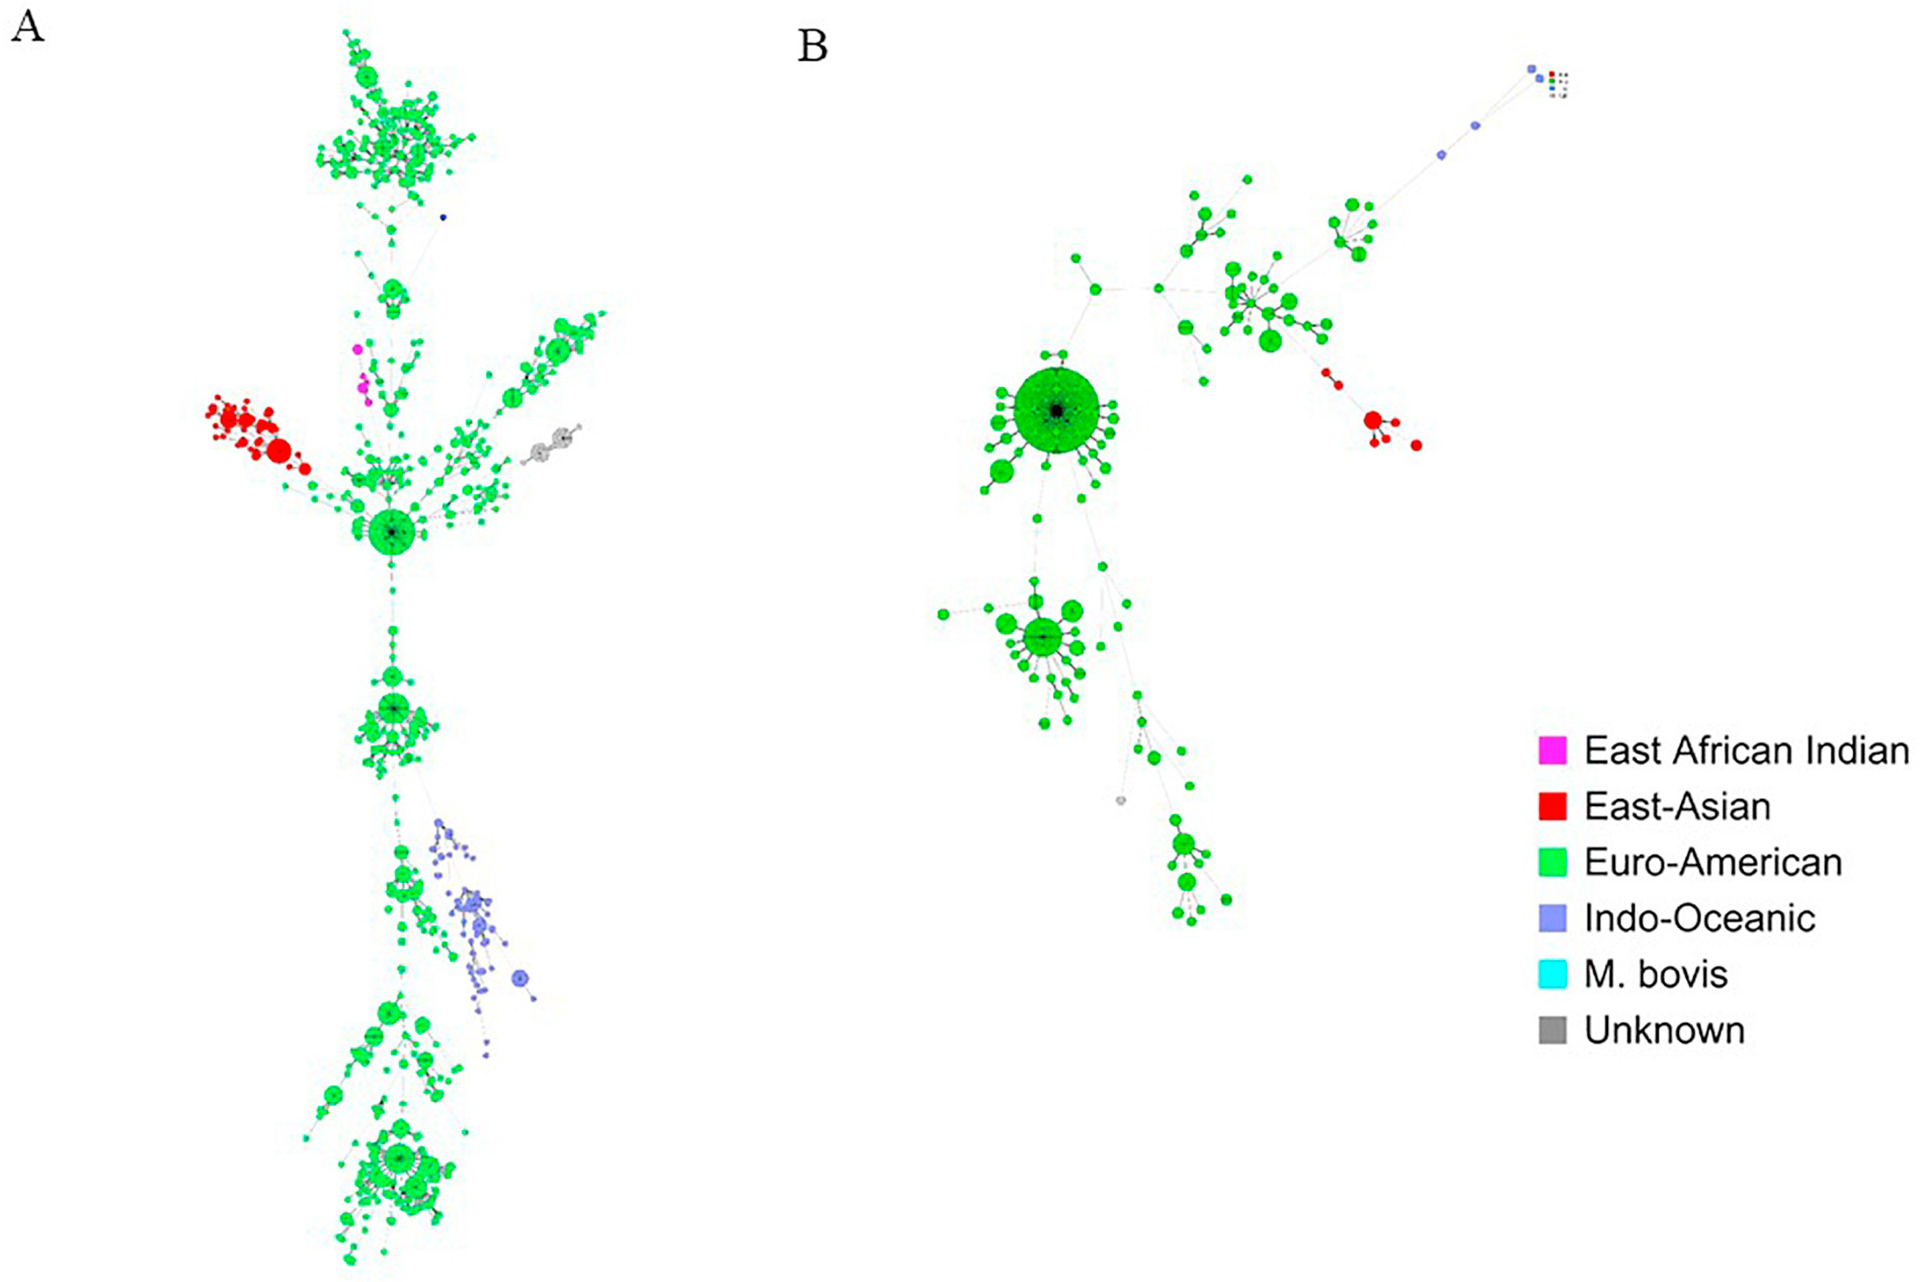
Fig. 4.

Minimal spanning trees of study strains in (a) Gaborone and (B) Ghanzi. Lineages are indicated by colors as specified in the key. Each circle represents a single MIRU-VNTR pattern. The size each circle corresponds to the number of strains with the same genotype (indicated as ‘pieces’ of the circle). Lines between circles indicate genetic distance between genotypes, with shorter lines indicating more genetic similarity.
