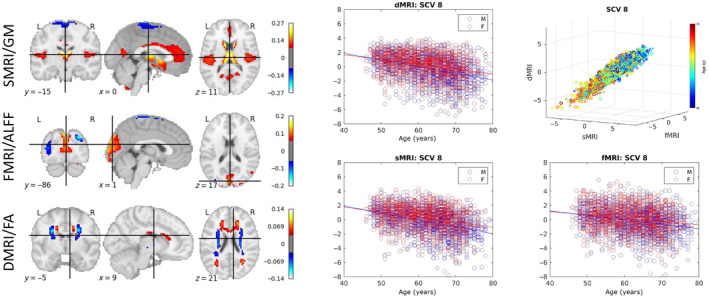
FIGURE 3.

Age‐related SCV. Left: The spatial maps corresponding to the mixing weights for each modality. Right: A 3D scatter plot of SCV 8 illustrates the strong association between multimodal subject expression levels, as well as their relationship to age, for the UK Biobank data. Each point represents a subject, color coded by the age (circles indicate males; crosses indicate females). The same data as in the top right panel is depicted separately for each modality on the other panels, plotted against subject age.
