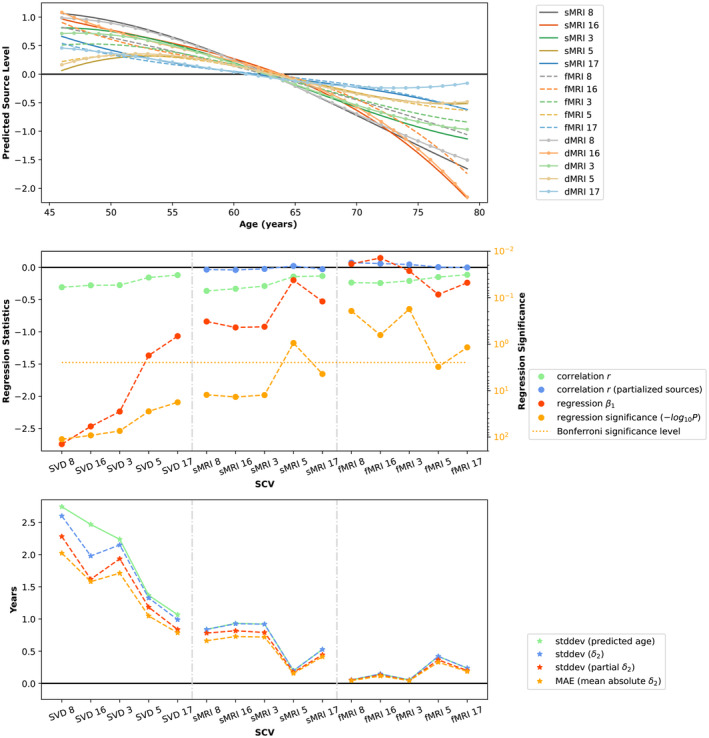
FIGURE 4.

Brain‐age delta modeling. Top: Predicted source levels as a function of chronological age using a cubic model. Middle: Regression statistics at Stage 1 of brain‐age delta modeling (see Equation 11 in Supporting Information). Bottom: Standard deviation of predicted age, standard deviation of Stage 2 brain‐age delta (see Equation 12 in Supporting Information) and its partialled version, and mean absolute error in Stage 2 brain‐age model. SCVs are sorted according to the correlation between their SVD‐shared features and age. The close agreement between standard deviations from predicted age and second stage brain‐age delta suggests that the patterns extracted from the imaging data are largely descriptive of brain age, rather than chronological age.
