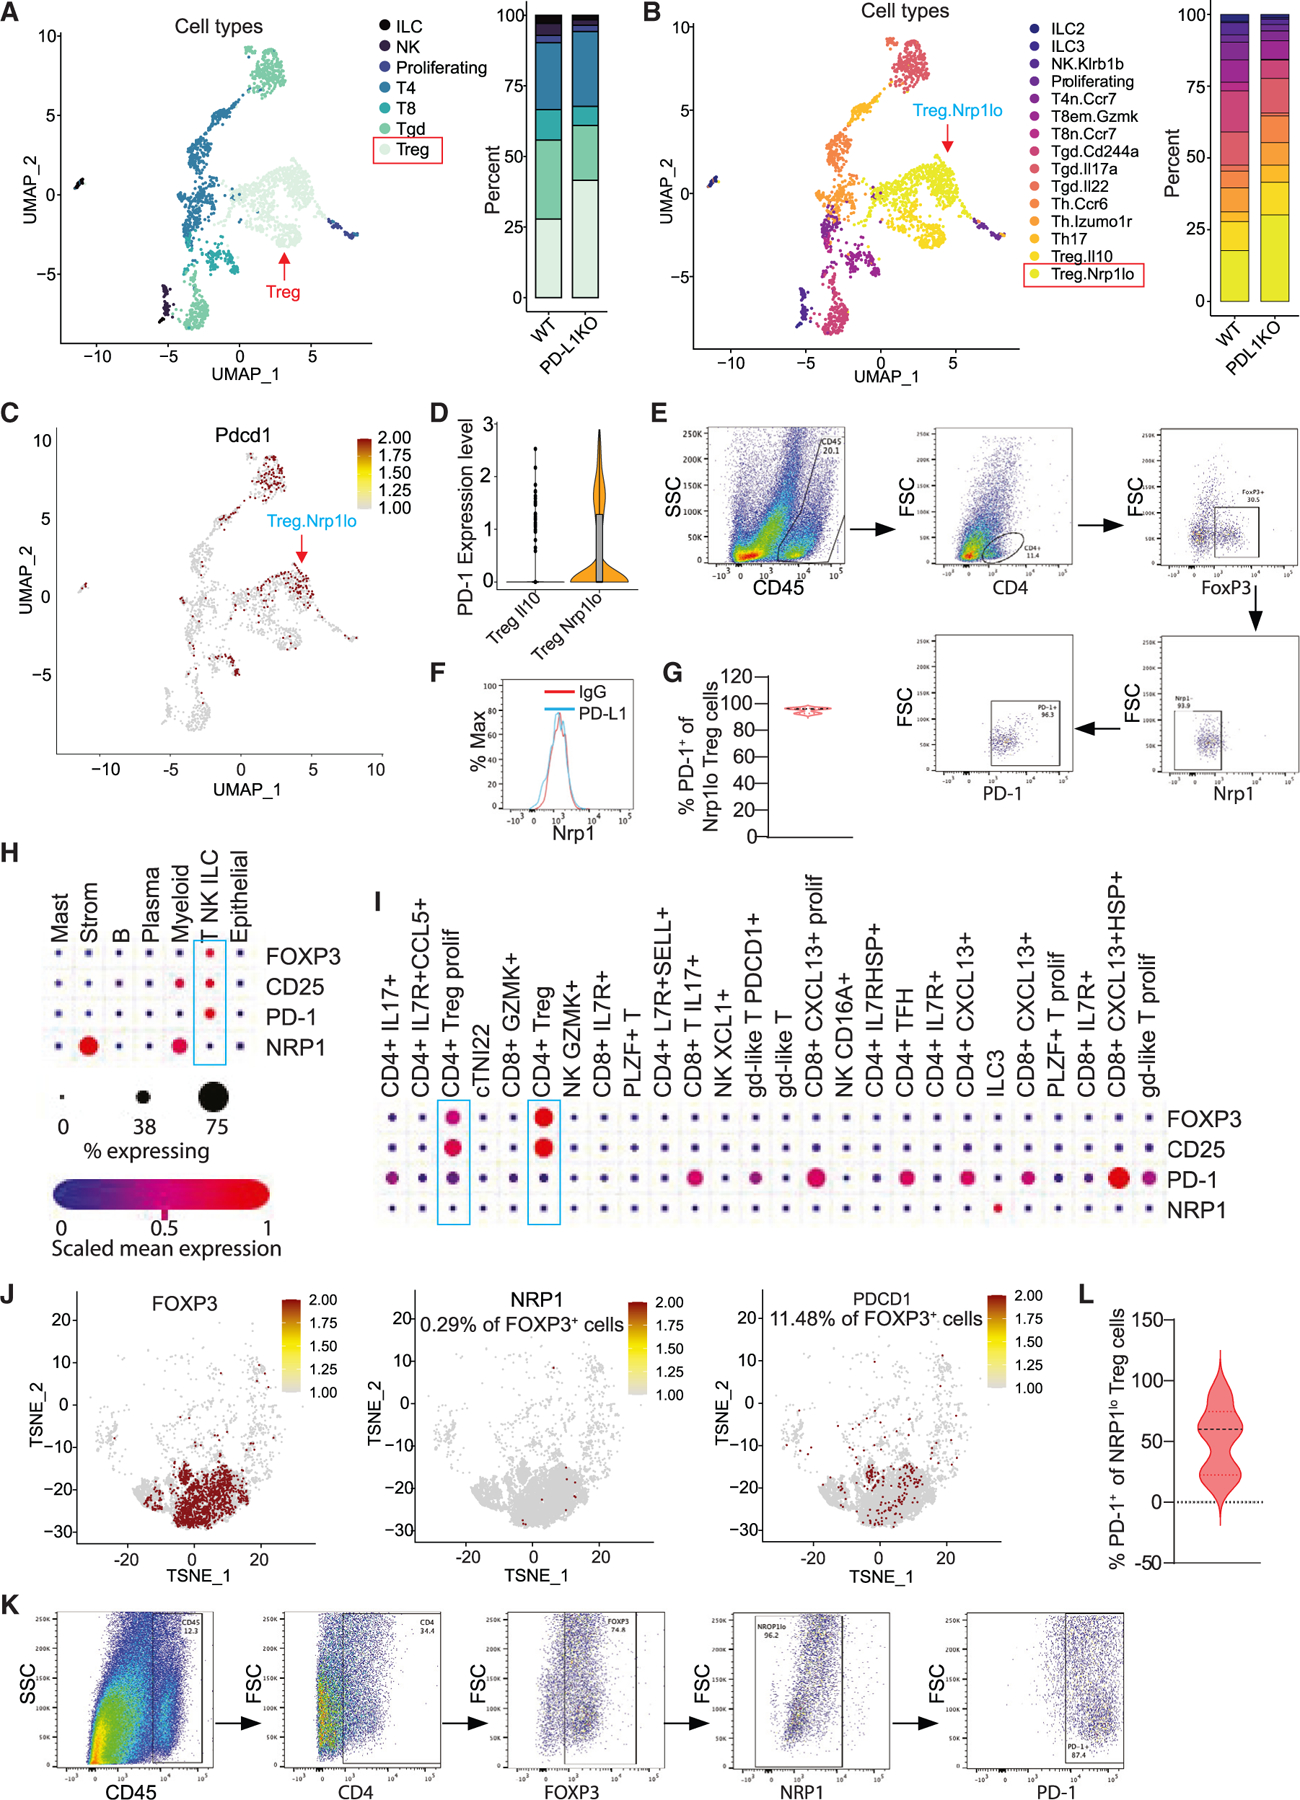
Figure 4. PD-L1 suppresses PD-1-expressing Nrp1lo Treg cell accumulation in colon tumor.

(A) UMAP projection (left) and barplot (right) of T, NK, and ILC in colon tumor at day 106. Treg, T regulatory cells; Tgd, γδ T cells; T8, CD8+ T cells; T4, CD4+ T cells; proliferating, proliferating cells; NK, NK cells; and ILC, innate lymphoid cells.
(B) UMAP projection (left) and barplot (right) of subpopulations of T, NK, and ILCs.
(C) UMAP projection showing PD-1 expression level in the indicated cell subpopulations as shown in (B).
(D) Expression of PD-1 in Treg subpopulations.
(E–G) Flow cytometry analysis of AOM-DSS-induced mouse colon tumors. Shown are representative gating strategies of one of five mice (E), representative Nrp1 expression level in Treg cells of one of five mice (F), and quantification of PD-1+ cells in Nrp1lo Treg cells (G) (n = 5).
(H and I) Human colon cancer patient scRNA-seq datasets (GEO: GSE178341) were analyzed for expression of the indicated genes in major cell types (H) and T cell subpopulations (I). The correlations are shown in dot plots.
(J) TSNE projection showing NRP1 and PDCD1 expression in POXP3+ cells in human colon tumor as shown in (H) and (I).
(K and L) Flow cytometry analysis of colon tumor tissues from human colon cancer patients. Shown are representative gating strategy of one of four mice (K) and quantification of PD-1+ cells in NRP1lo Treg cells (L) (n = 4).
