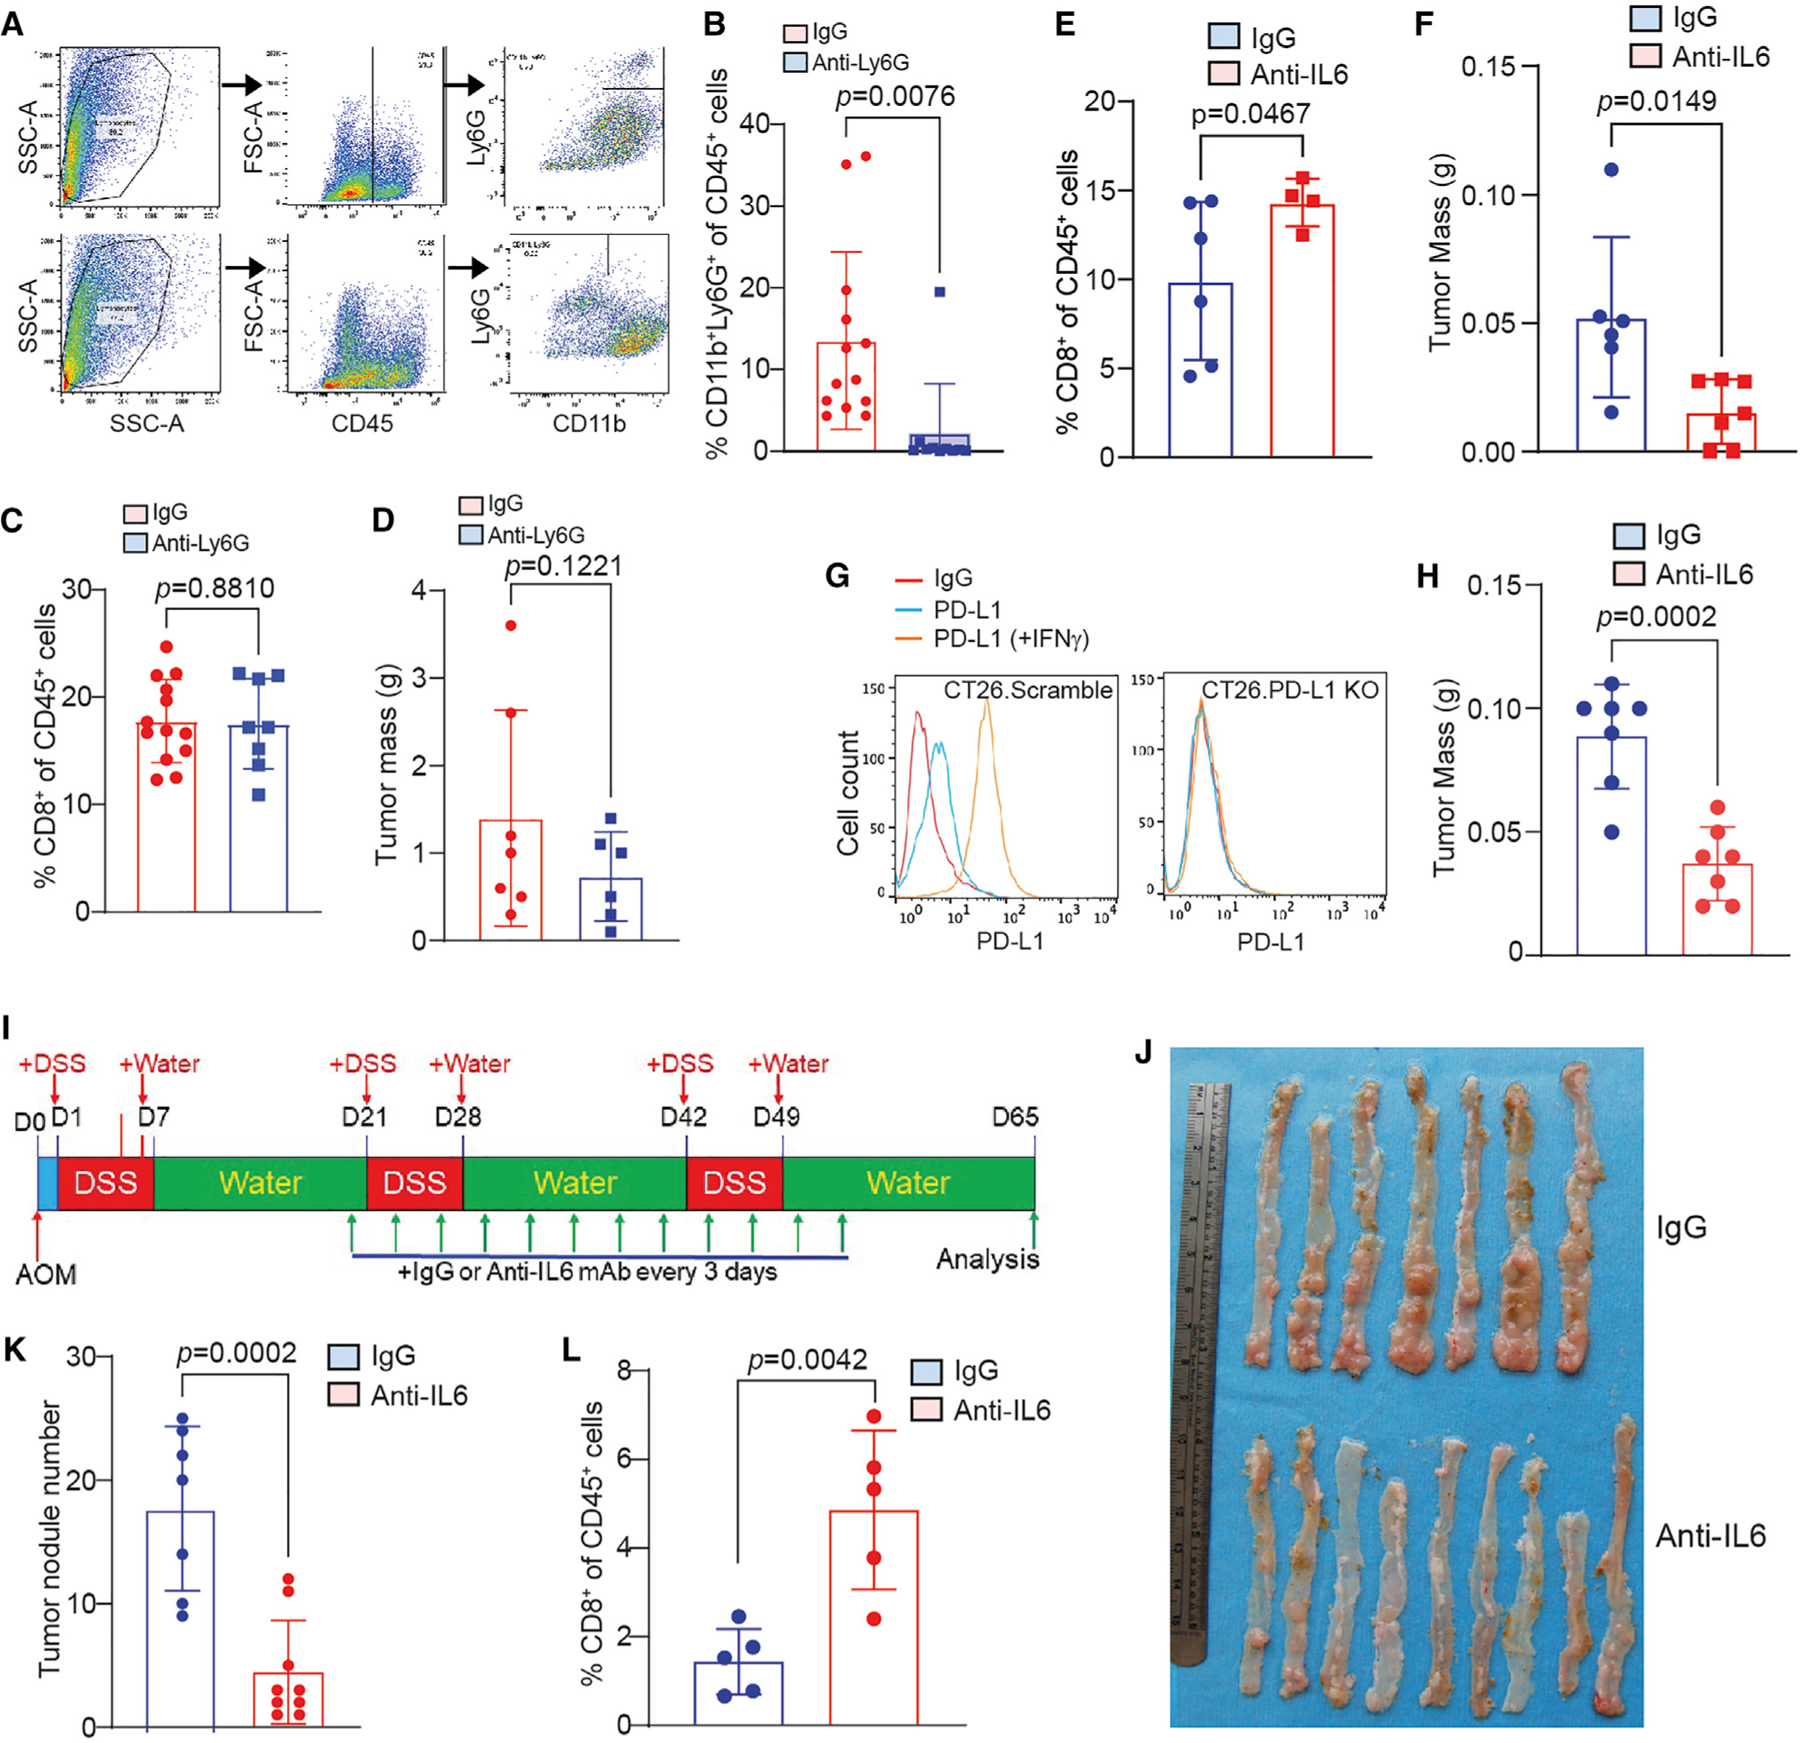
Figure 7. IL6 blockade immunotherapy activates T cells and suppresses colon tumor growth in vivo.

(A–D) CT26 orthotopic tumor-bearing mice were treated with Ly6G neutralization mAb. Shown are flow cytometry analysis representative gating strategy of the tumor of one of 13 mice (A), quantification of tumor-infiltrating neutrophils (B), quantification of tumor-infiltrating CD8+ T cells (C), and tumor weight (D). Column, mean; bar, SD. p value was determined by Student’s t test. Each dot represents data from one mouse.
(E and F) CT26 orthotopic tumor-bearing mice were treated with IL6 neutralization mAb. Shown are quantification of tumor-infiltrating CD8+ T cells by flow cytometry (E), and tumor weight (F). Column, mean; bar, SD. p value was determined by Student’s t test. Each dot represents data from one mouse.
(G) Generation of PD-L1 KO colon tumor CT26 cells.
(H) PD-L1 KO CT26 orthotopic tumor-bearing mice were treated with IL6 neutralization mAb and measured for tumor weight at the endpoint. Column, mean; bar, SD. p value was determined by Student’s t test. Each dot represents data from one mouse.
(I–L) The AOM-DSS-induced colon tumor mice were treated with IL6 neutralization mAb. Shown are treatment scheme (I), tumor-bearing colons (J), colon tumor nodule number (K), and tumor-infiltrating CD8+ T cell level (L). Column, mean; bar, SD. p value was determined by Student’s t test. Each dot represents data from one mouse.
