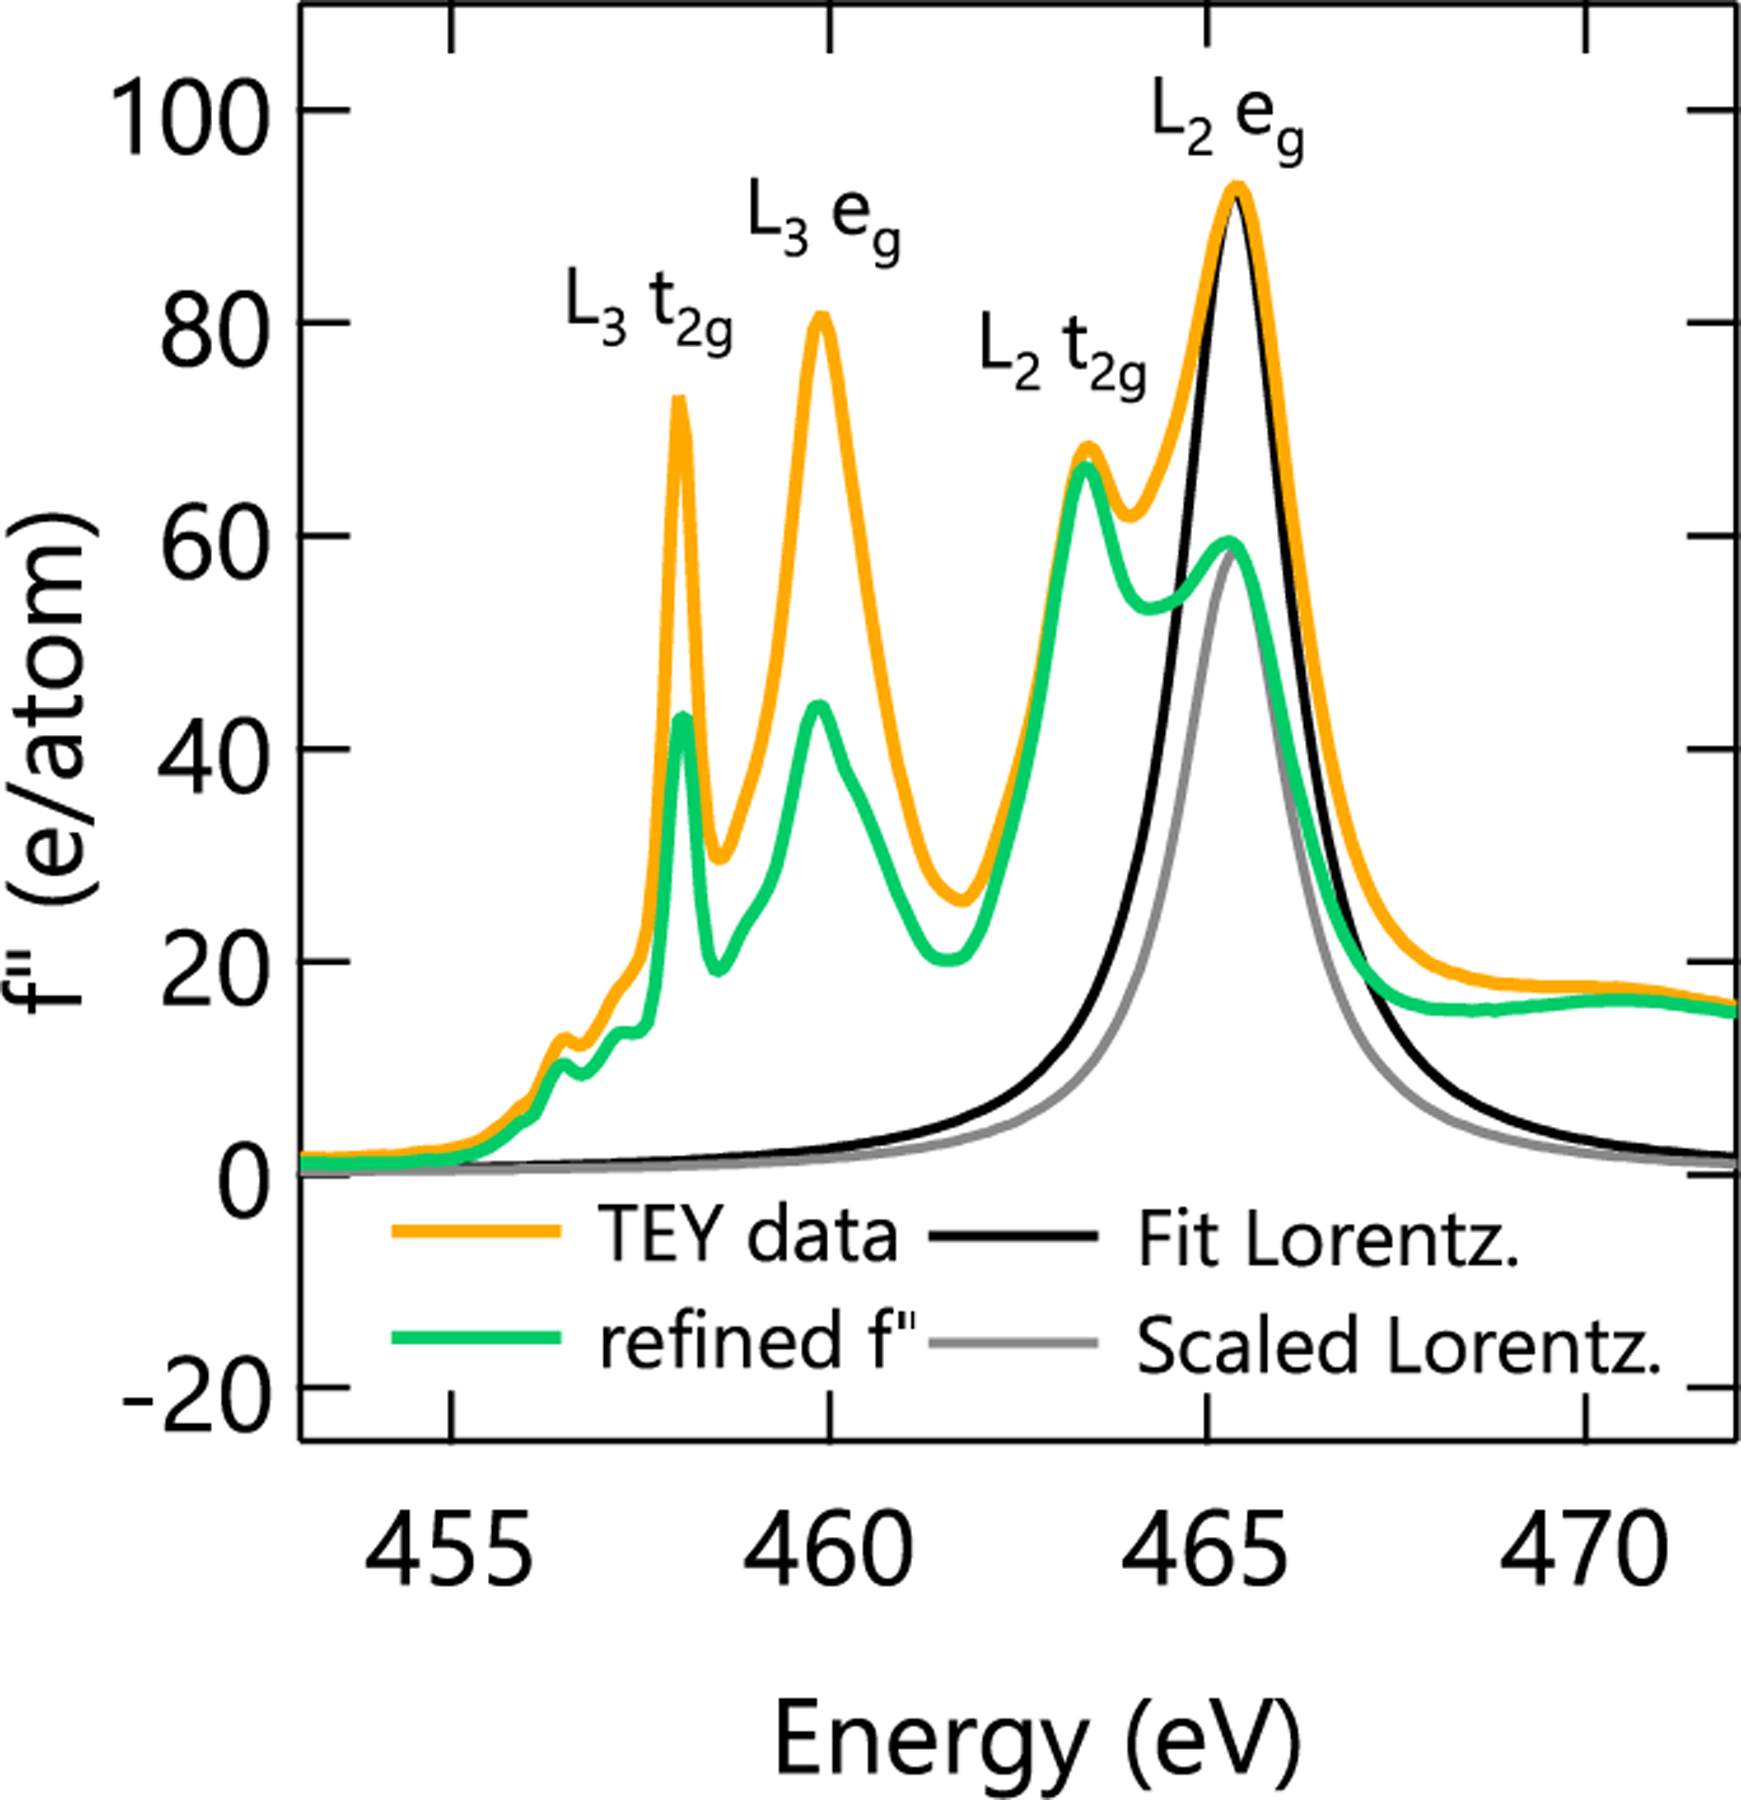
FIG. 2.

Measured TEY (yellow) and refined (green) spectra of the imaginary anomalous scattering factor for the SmTO control film. The fit (black) and scaled (grey) Lorentzian peaks are used to refine the measured XAS profile as described in the main text. Please note that, as described in the main text, the refined f′′ spectra are only accurate near the TEY peak energies where our reflectometry data were collected.
