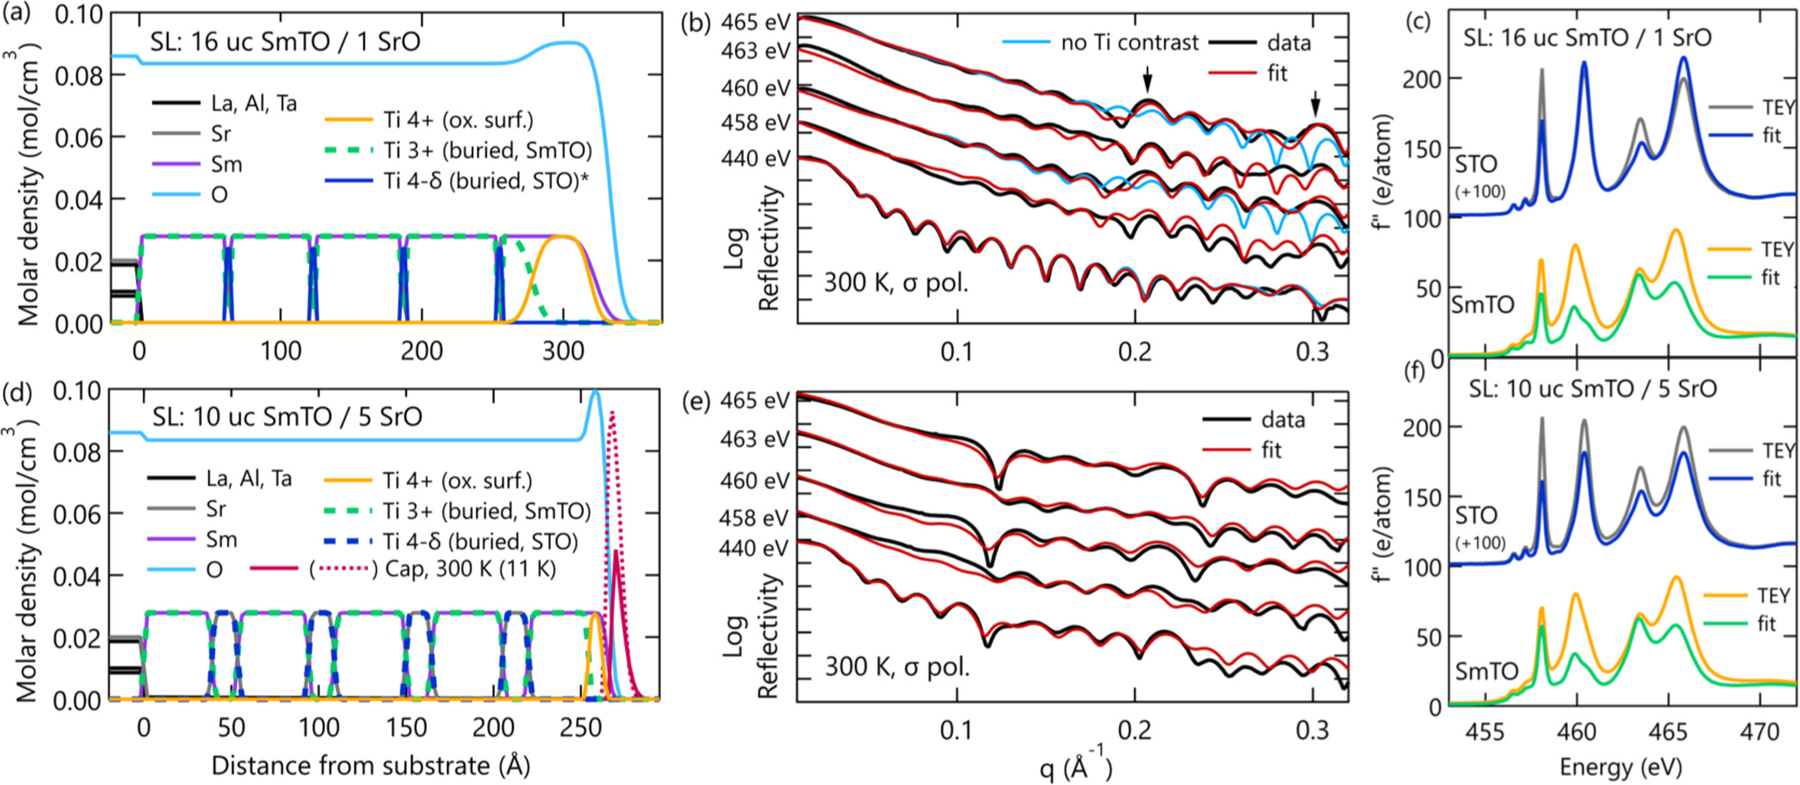
FIG. 5.

Results of reflectivity refinements for the two superlattice samples. Sample layer models (a) and (d) show each sample’s structure through the combination of multiple elemental depth profiles. The Ti profiles are plotted as dashed lines to show the Sm and Sr profiles that are directly overlapped by Ti. Note the exception of Ti4−δ in (a), which was left solid to clearly show the 1 SrO layers. Fits (red) to 300 K sigma reflectivity data (black) are plotted in panels (b) and (e). Also in panel (b) are the poor fits (light blue) from a comparative model without Ti contrast as described in the main text. Arrows point to superlattice peaks. Finally, the measured (grey and yellow) and refined (blue and green) f′′ spectra for the STO and SmTO layers are shown in panels (c) and (f) for the 16:1 and 10:5 superlattices, respectively. Please note that, as described in the main text, the refined f′′ spectra are only accurate near the TEY peak energies where our reflectometry data were collected.
