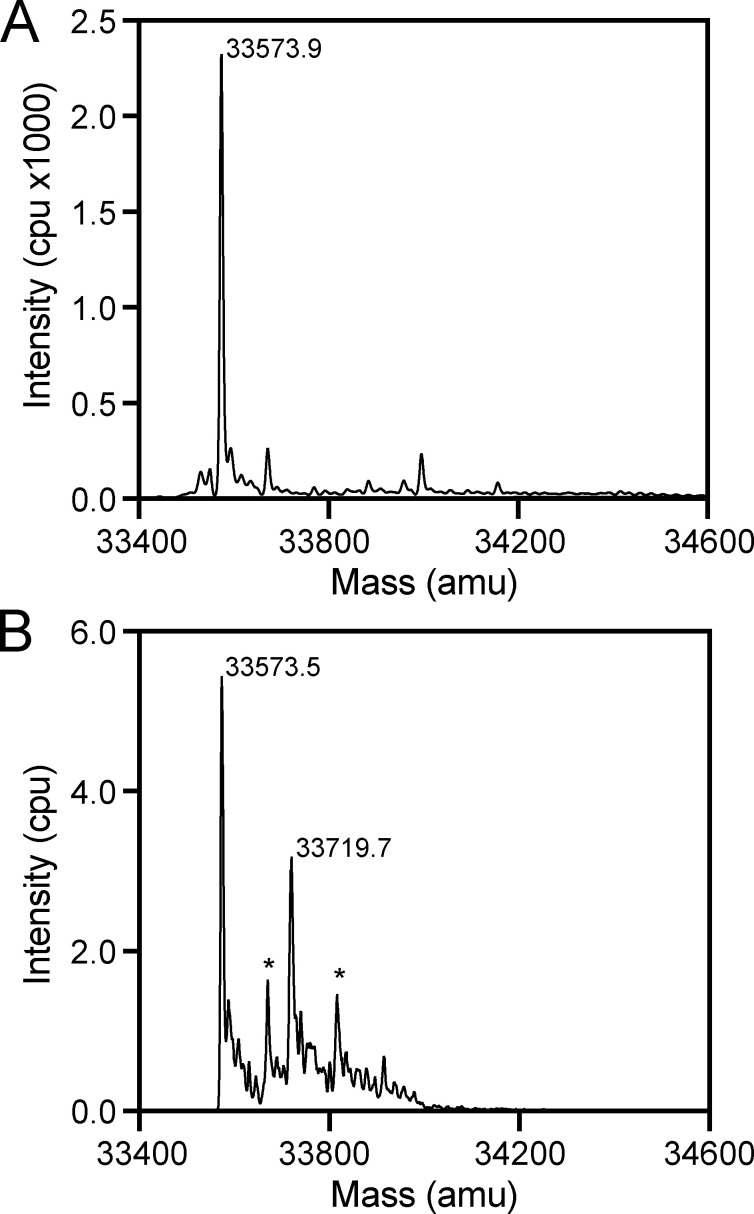
Figure 2.
Identification of ligand mass using mass spectrometry. (A) Denaturing MS analysis of VC0430 reveals a single peak corresponding to a mass of 33,573.9 Da. (B) Native MS analysis of VC0430 reveals major peaks corresponding to masses of 33,573.9 and 33,719.7 Da, which represent the apo and ligand bound VC0430, respectively. Peaks labeled with an * correspond with phosphate adducts of the major peaks.

