Figure 3.
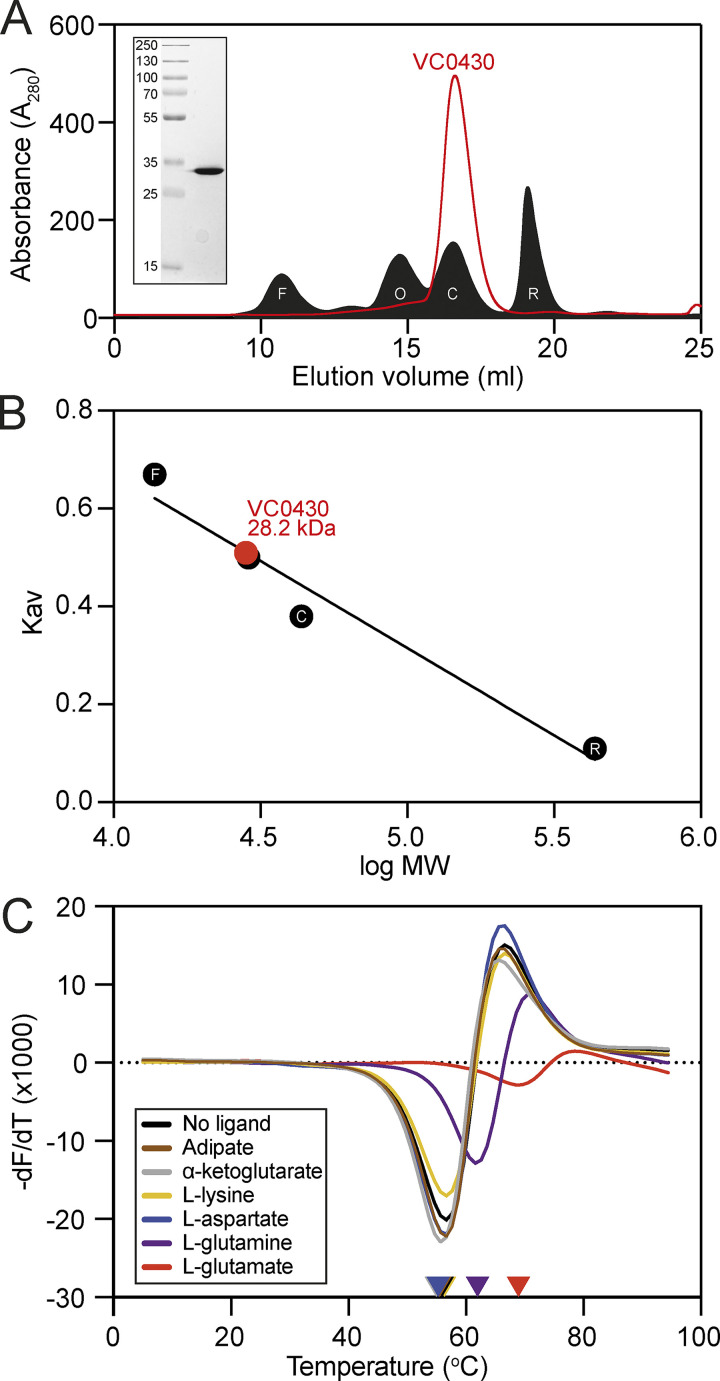
Purification, analytical size exclusion chromatography, and ligand binding of VC0430. (A) SEC elution profile of VC0430 (red line) compared to the profiles of four standards (filled black trace); ferritin (F, 10.67 ml elution volume), ovalbumin (O, 14.71 ml), carbonic anhydrase (C, 16.52 ml), and ribonuclease A (R, 19.08 ml). (B) Molecular weight calibration curve showing Kav as a function of the log MW of the four standards from A (black circles, labels are the same as in A). Comparison of the VC0430’s Kav reveals an MW of 28.2 kDa. (C) Derivatives of the unfolding curves (dF/dT) for VC0430 in the absence of ligand and the presence of 1 mM adipate, a-ketoglutarate, L-aspartate, L-glutamate, L-glutamine, and L-lysine. Colored arrow on the X-axis indicates the apparent protein Tm under those conditions. Information regarding replicates can be found in Table S2. Source data are available for this figure: SourceData F3.

