Figure 7.
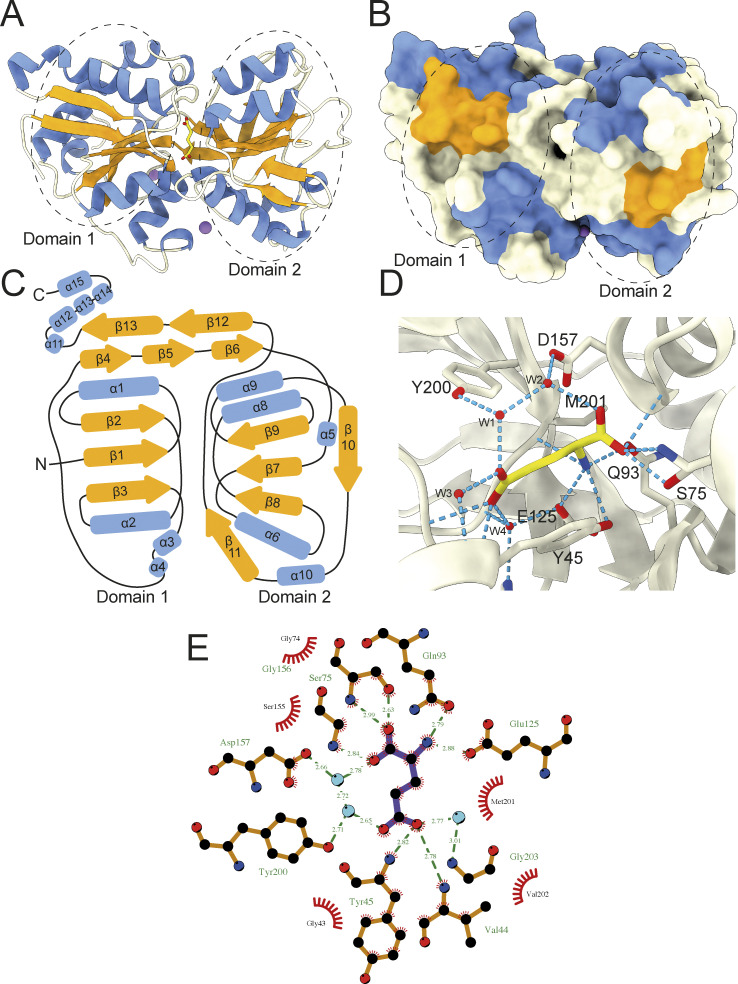
Structural characterization of L-glutamate bound VcGluP. (A) Cartoon representation of VcGluP colored according to secondary structure, α-helices in blue, β-sheets in orange, loops in white. The bound L-glutamate is shown in yellow in the central cavity and the Na+ ions are purple spheres. Domains 1 and 2 are demarcated by dashed lines. (B) Surface representation of VcGluP colored and in the same pose as in A. The lack of solvent accessibility to the binding site indicates that VcGluP is in a closed state. (C) Topology map of VcGluP, colored as in A. (D) Ligand binding site of VcGluP showing the interactions with the bounds L-glutamate. (E) LigPlot+ representation of the ligand binding site (ligand is purple sticks and water molecules are light blue circles).

