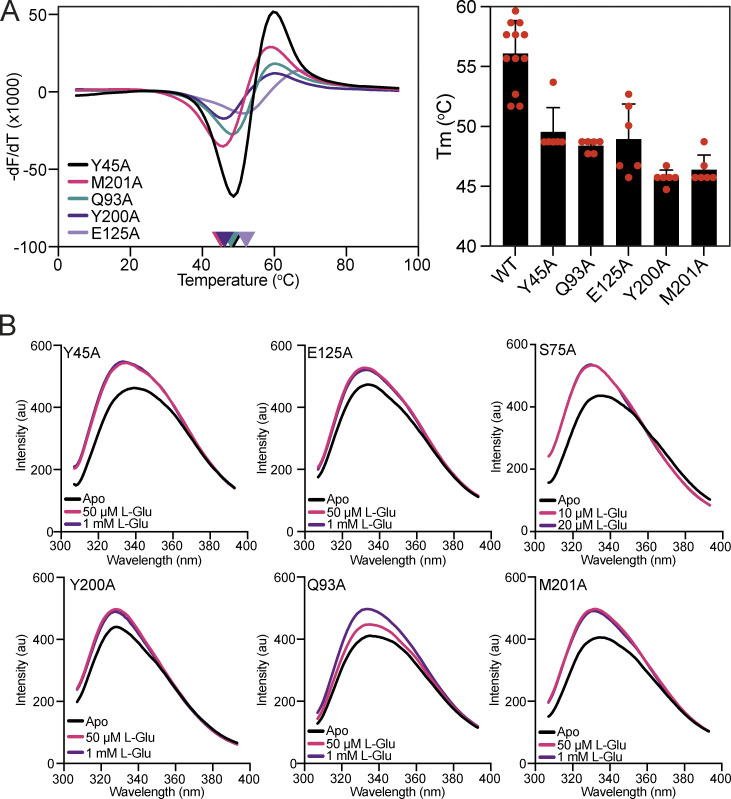
Figure S3.
Thermostability and tryptophan fluorescence analysis of VcGluP binding site mutants. (A) Melting temperature of each VcGluP binding site mutant. Left panel: Representative DSF data for each VcGluP binding site mutant in the absence of substrate. Right panel: The Tm of each binding site mutant derived from the DSF assay. Error bars represent standard deviation and individual datapoints are shown in red. (B) Emission scans of each mutant with an excitation wavelength of 295 nm in the presence and absence of L-glutamate.

