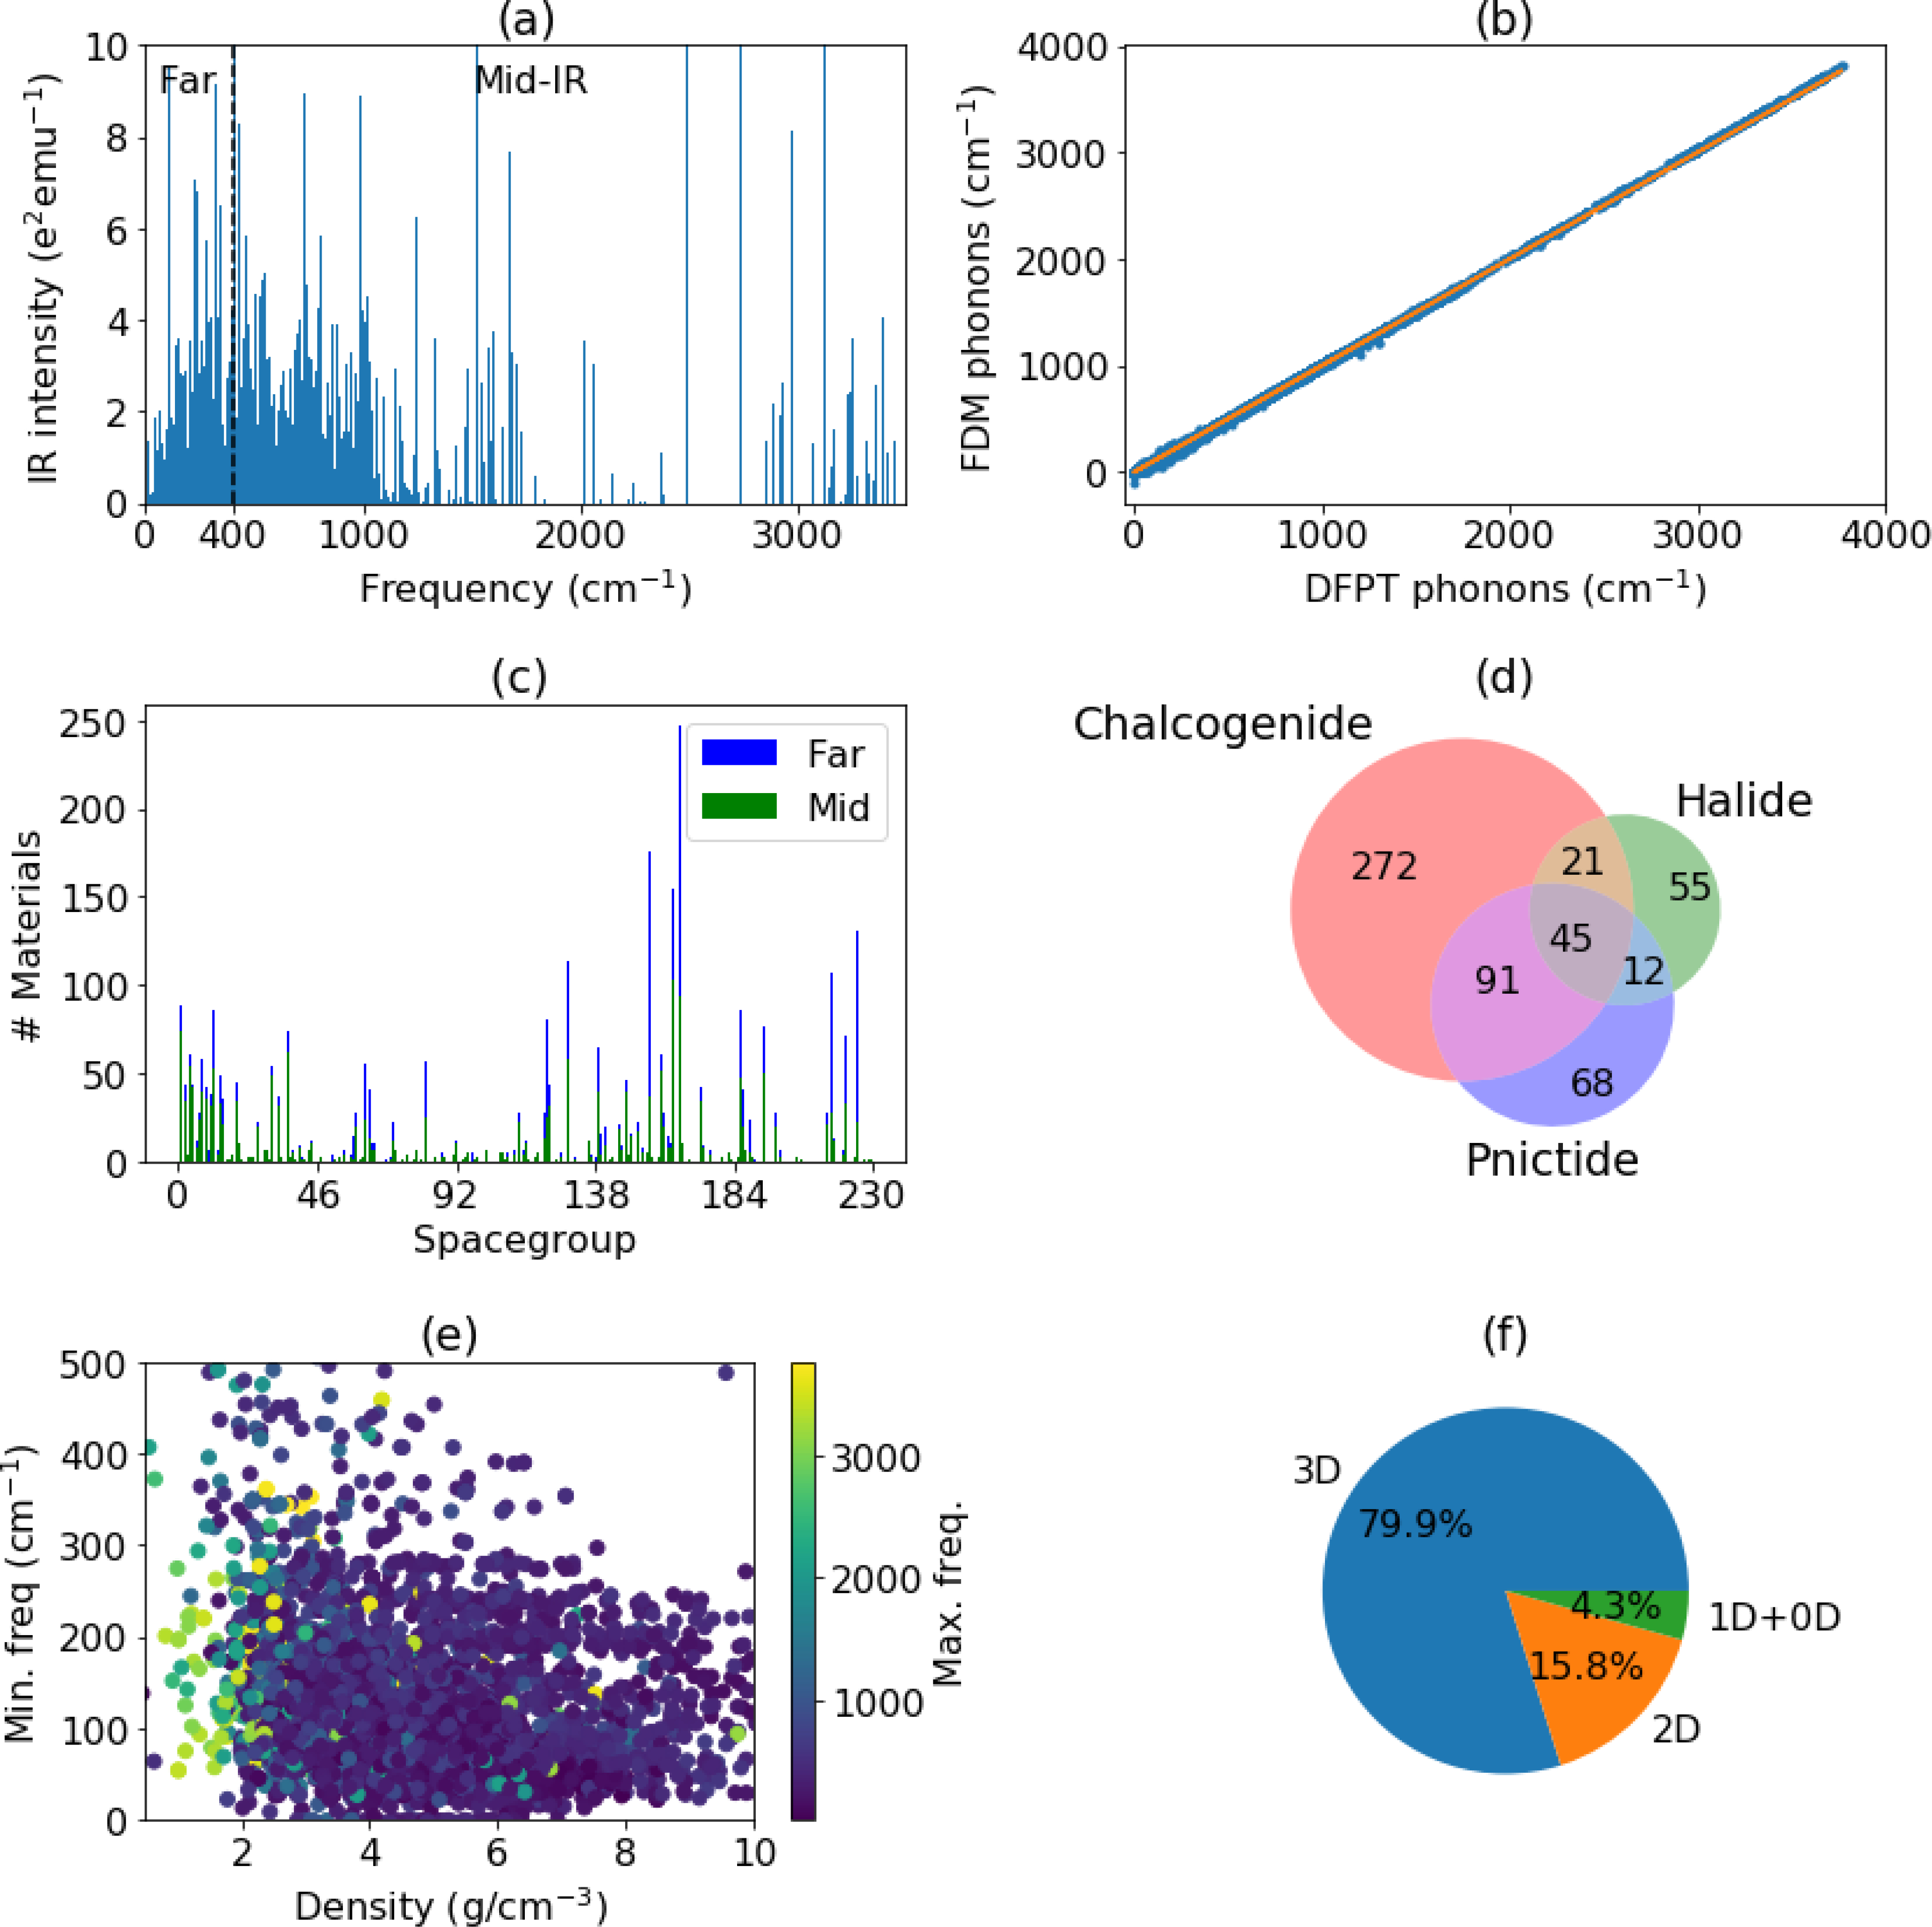
Fig. 2.

Analysis of the IR-data. a) IR peaks for all the materials in the database, b) Comparison of finite-difference (FDM) and DFPT phonon frequencies for conventional cells, c) space-group distributions of materials with at least one far (blue) and mid (green) IR peaks, d) Venn-diagram of the chemistry of materials containing chalcogenides, halides. or pnictides. materials, e) Minimum frequency vs density of the system, f) dimensionality analysis of the far-IR materials.
