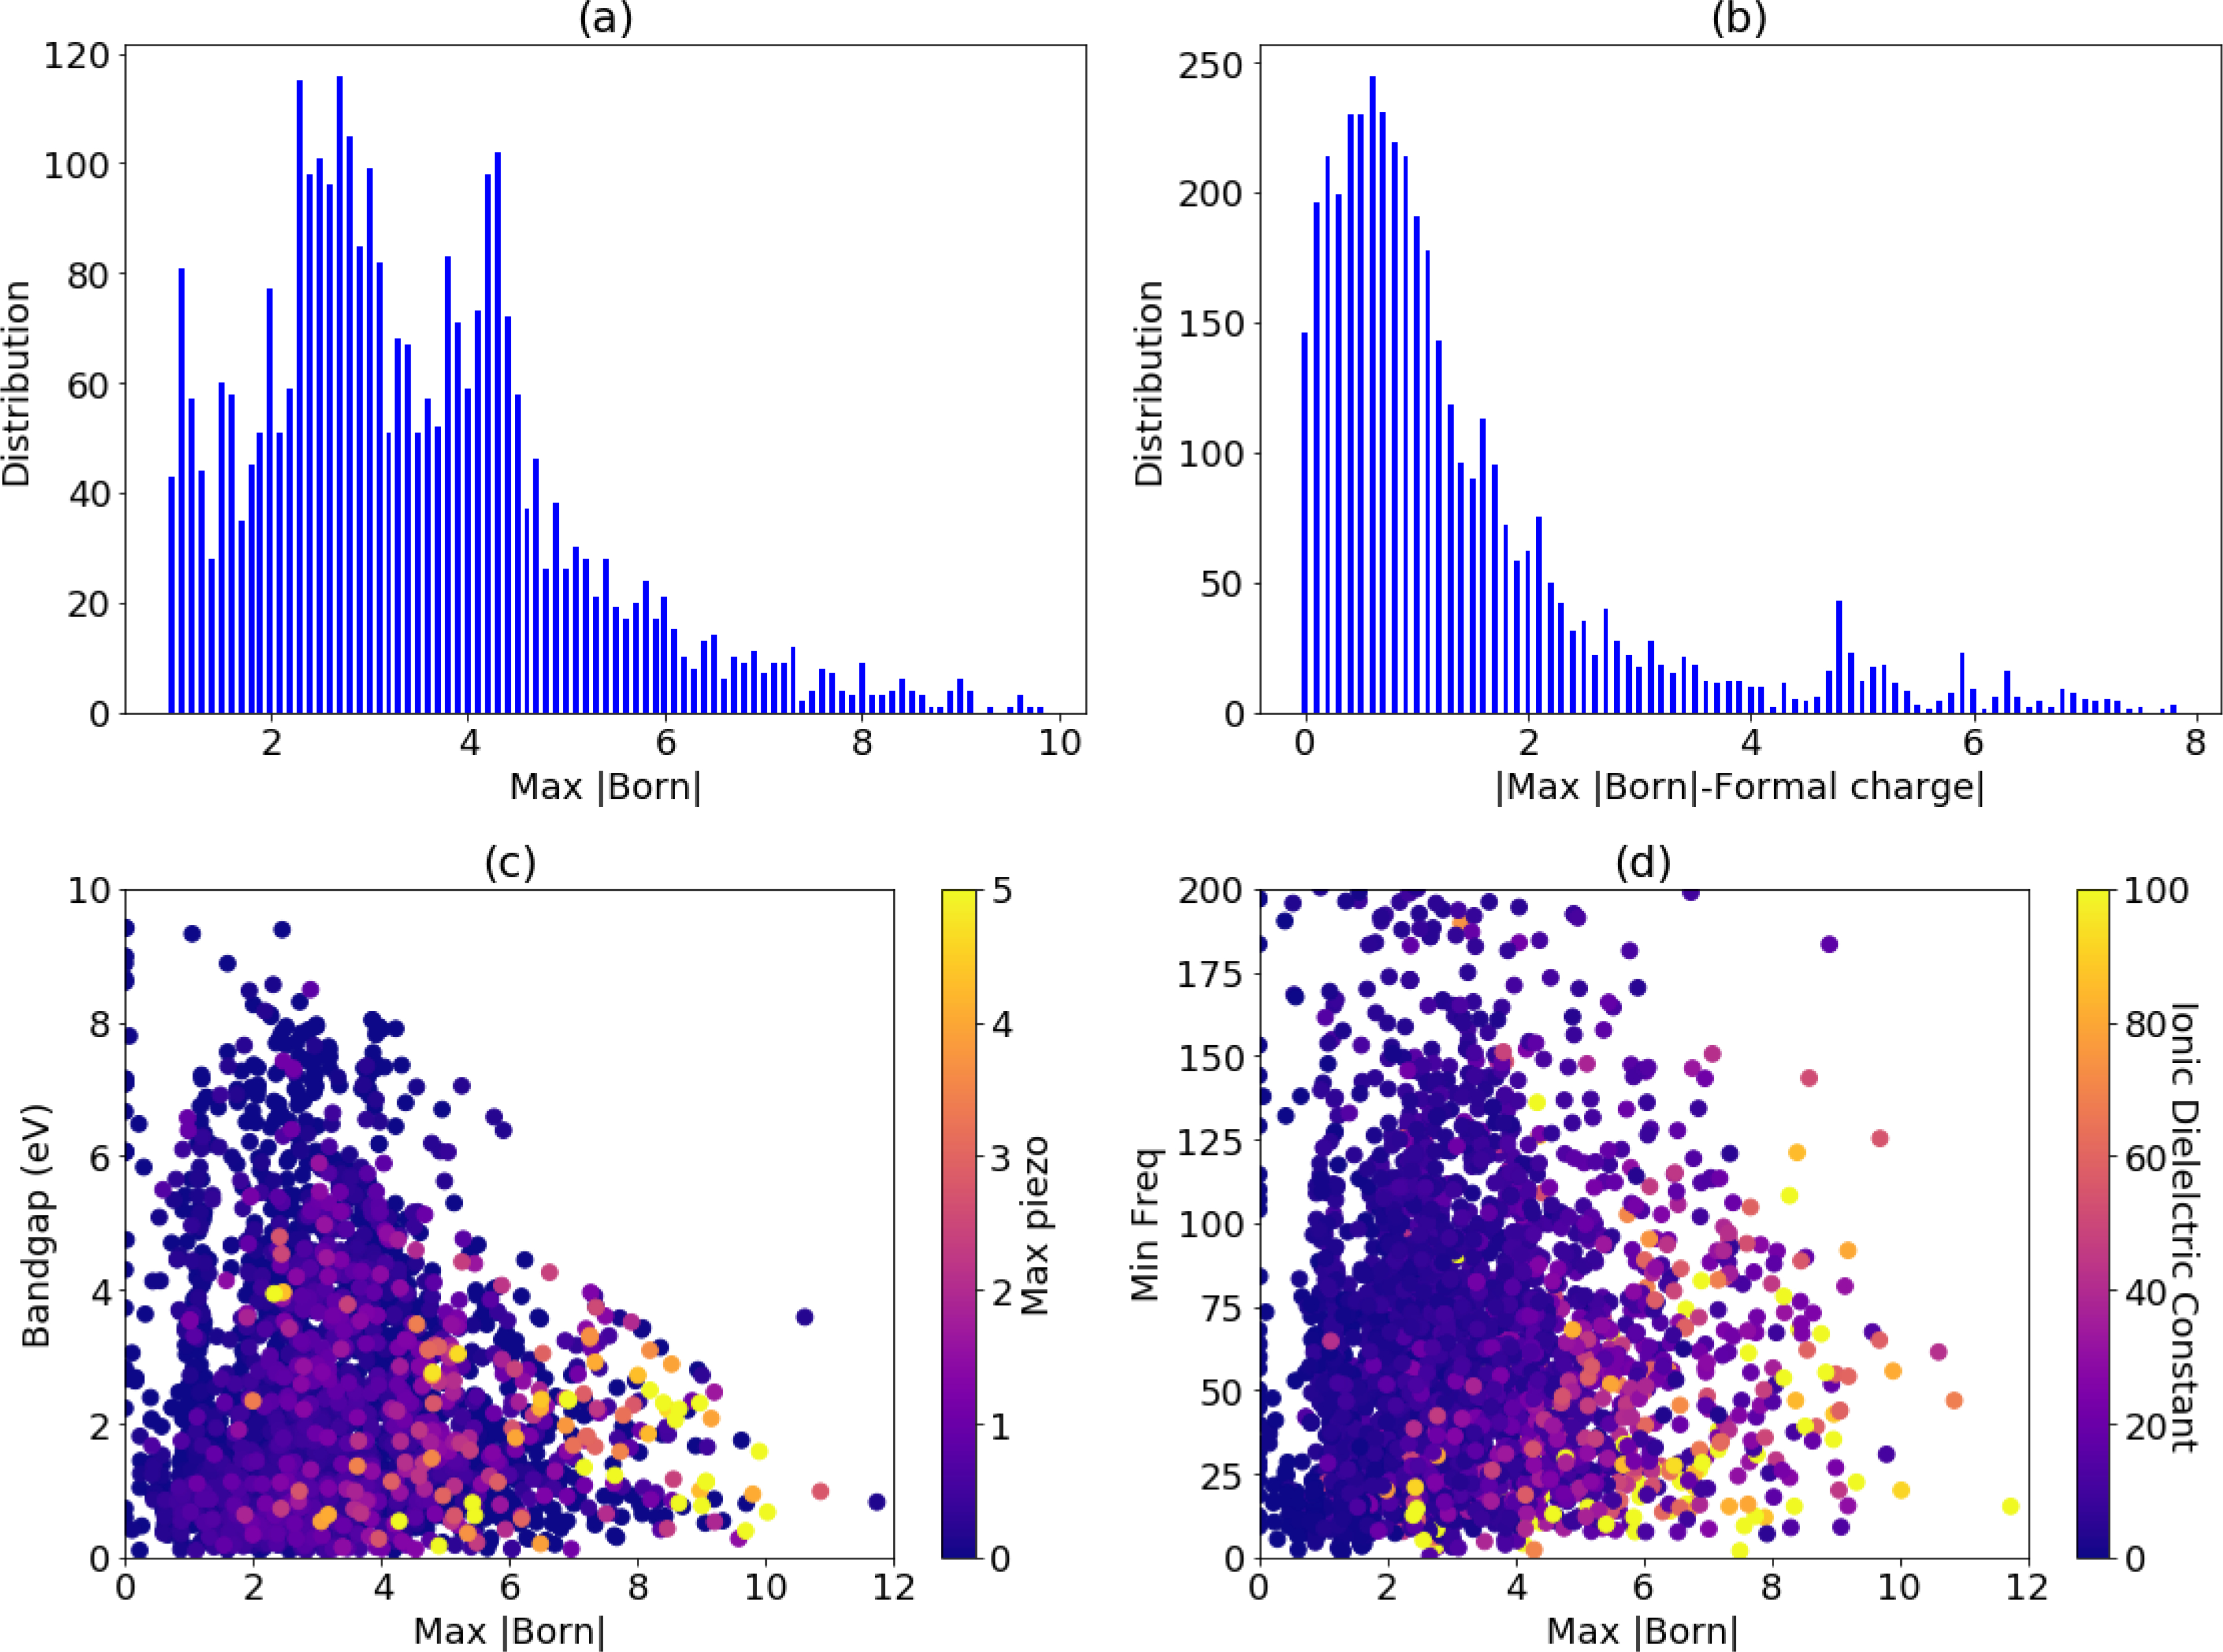
Fig. 6.

Born effective charge distribution and its relation to PZ, DL and bandgaps. a) Histogram of Born-effective charge data, b) histogram of maximum BEC and formal charge c) BEC wrt bandgap with color-coded max PZ, d) BEC with respect to the min-IR-frequency with color-coded ionic part of dielectric constant.
