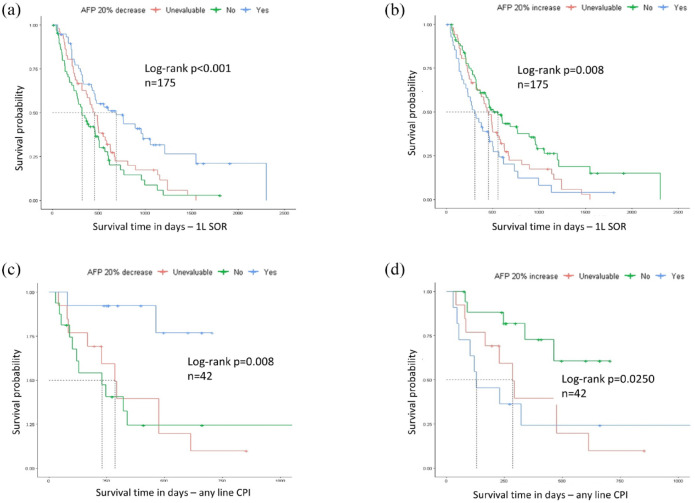
Figure 1.
Kaplan–Meier curves for OS stratified by AFP response or progression. (a) OS in SOR-treated patients, stratified by AFP response ⩾20%. (b) OS in SOR-treated patients, stratified by AFP progression ⩾20%. (c) OS in CPI-treated patients, stratified by AFP response ⩾20%. (d) OS in CPI-treated patients, stratified by AFP progression ⩾20%.
APE, alpha-fetoprotein; CPI, checkpoint inhibitor; OS, overall survival; SOR, sorafenib.

