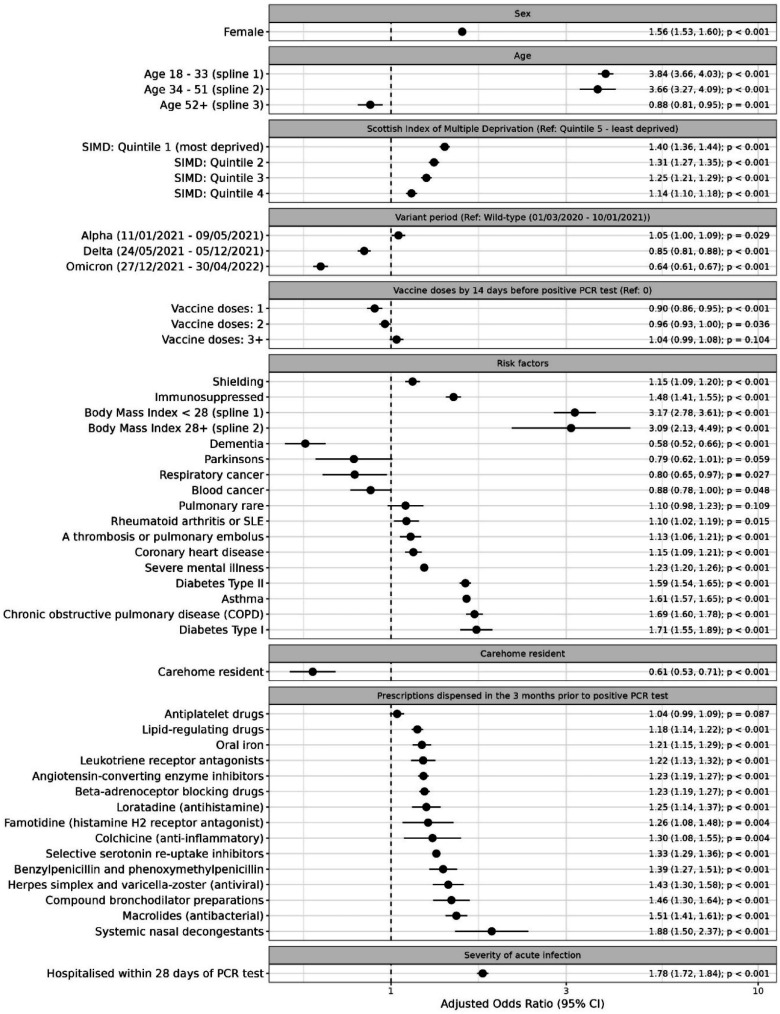
Figure 3.
Adjusted odds ratios for predictors of long COVID. The plot illustrates the adjusted odds ratios and 95% confidence intervals for all predictors of long COVID included in the main multivariable logistic regression model. The model was trained on the training dataset (n = 882,782) using multivariable logistic regression with 10-fold cross-validation. SIMD quintiles relate to quintiles of the Scottish Index of Multiple Deprivation.

