Fig. 5.
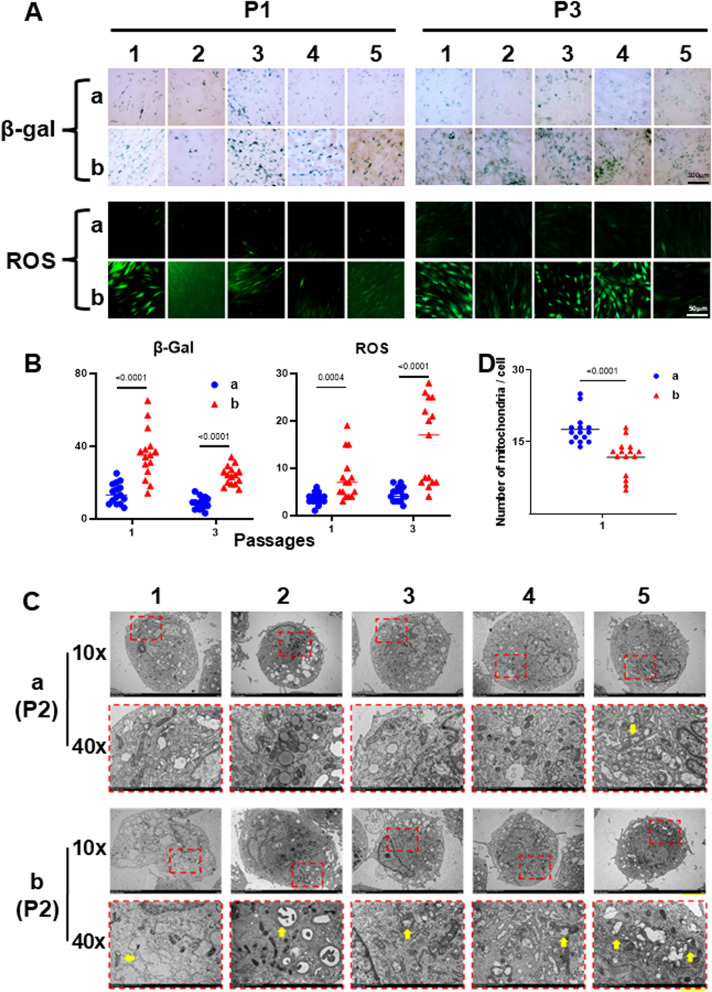
Comparison of senescent cells and intracellular ROS levels and transmission electron micrographs of AD-MSCs from sub-groups a versus b. Passage 1 and 3 AD-MSCs were seeded onto tissue culture plastic (TCP) at 6000 cells/cm2 and cultured for 7 days (> 80% confluent). Senescent cells were detected by β-galactosidase (β-gal) staining, while intracellular ROS levels were measured using 2′,7′-dichlorofluorescin diacetate (DCFHDA). A Images obtained from 5 individual patients (numbers of 1–5) for each sub-group. Upper panel: β-gal positive cells (brightfield microscopy); and lower panel: ROS positive cells (fluorescence microscopy). B Numbers of positive cells were counted (each of the 5 donor’s cells [per sub-group] was assayed in triplicate), the data presented by sub-group, and statistical comparisons performed. **P < 0.05 (n = 15), vs. sub-group b (mean ± SD) at the same passage. C Mitochondrial ultrastructure is shown in a high magnification version (lower panel, “40X”) of the low magnification version (upper panel, “10X”). Yellow arrows indicate mitochondrial damage (enlarged or dense cored vesicles). D The number of normal mitochondria per cell

