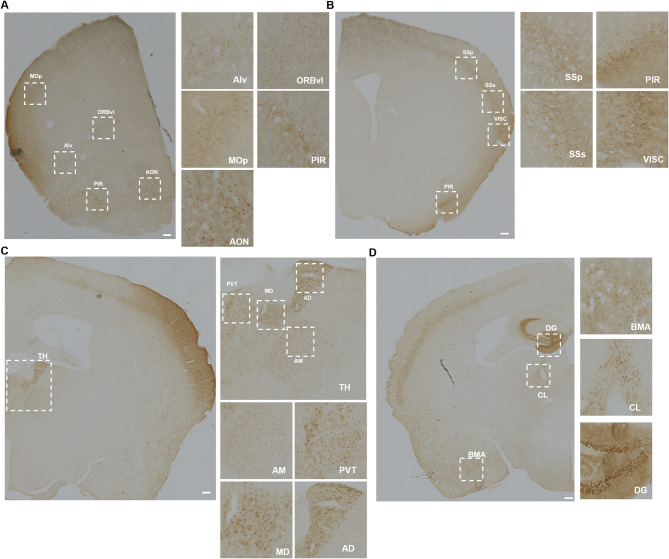
Fig. 3.
Representative images of IL-1R1 expression on glutamatergic neurons in different brain sections. (A) Representative images of tdTomato immunolabeling in Vglut2-Cre-Il1r1r/r mice, highlighting the cortex and olfactory areas. MOp, primary motor area; ORBvl, orbital area, ventrolateral part; Alv, agranular insular area, ventral part; PIR, piriform area; AON, anterior olfactory nucleus. The dashed squares indicate areas with high neuronal IL-1R1 expression and are magnified. Scale bar = 200 μm (B) Representative images of tdTomato immunolabeling in the Vglut2-Cre-Il1r1r/r somatosensory areas, visceral areas, and piriform area. SSp, primary somatosensory area; SSs, supplementary somatosensory area; VISC, visceral areas; PIR, piriform area. Scale bar: 200 μm (C) Representative images of DAB labeling in various thalamic nuclei of the Vglut2-Cre-Il1r1r/r mouse. AD, anterodorsal nucleus; MD, mediodorsal nucleus of thalamus; PVT, paraventricular nucleus of thalamus; AM, anteromedial nucleus. Scale bar: 200 μm (D) Representative images of tdTomato immunolabeling in Vglut2-Cre-Il1r1r/r mouse dentate gyrus (DG), central lateral nucleus of the thalamus (CL), and basomedial amygdalar nucleus (BMA). Scale bar = 200 μm

