Fig. 6.
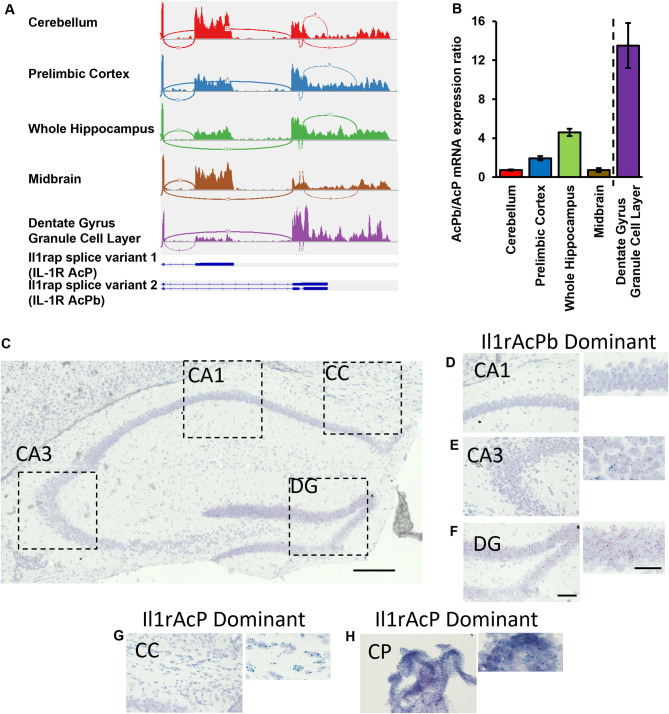
IL-1R1 expressing neurons utilize alternatively spliced accessory protein, IL-1RAcPb. (A) Sashimi plots from RNAseq data analyses of different brain areas and schematics showing the last two exons of Il1rap. (D) Quantification of AcPb/AcP RNA transcripts ratio in different brain areas. Dashed line separates two different RNAseq experiments. Error bars represent the mean ± SEM. (C) Photomicrograph of the WT hippocampus following BaseScope in situ hybridization of exon junction regions for IL-1RAcP (Blue-Green) and IL-1RAcPb (Red). Scale bar = 300 μm Dotted lines indicate magnified regions presented in D-G. (D-F) Photomicrographs of predominantly IL-1RAcPb expression regions, such as the CA1 (D), CA3 (E), and DG (F), which are magnified images to the right of each corresponding image. (G-H) Photomicrographs of predominantly IL-1RAcP expressing regions of the corpus callosum (G) and the choroid plexus (H), which are magnified images to the right of each corresponding image. DG, dentate gyrus; CC, corpus callosum; CP, choroid plexus. Scale bar = 100 μm

