Fig 2.
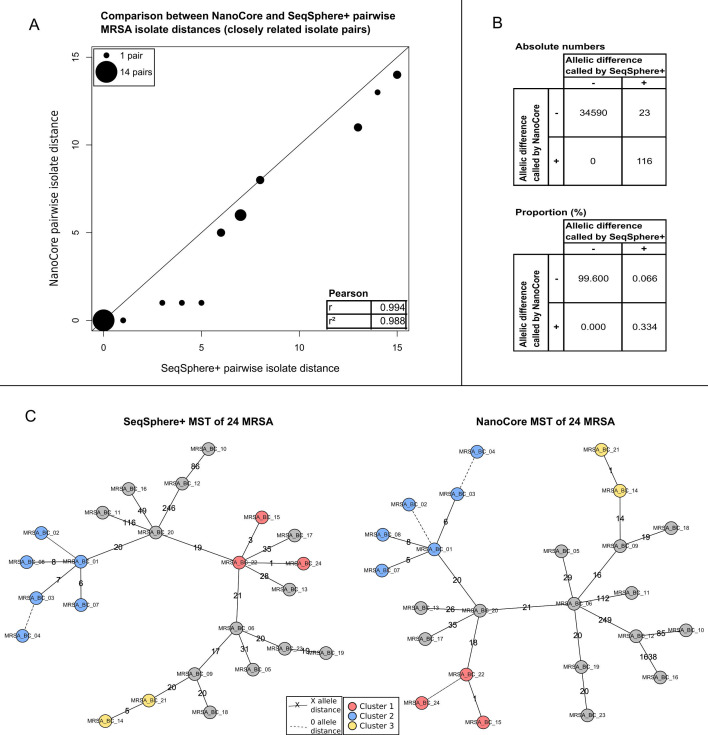
Analysis of 24 MRSA isolates. (A) Comparison of NanoCore- and SeqSphere+-based pairwise isolate distances for pairs of closely related isolates (SeqSphere+ distance ≤ 15), with Pearson correlation shown in the inset. Point sizes are scaled according to the number of pairwise distances with identical coordinates. (B) Comparison of individual-gene NanoCore and SeqSphere+ results across closely related isolate pairs (SeqSphere+ distance ≤ 15). Shown are results from genes that were analyzed by both NanoCore and SeqSphere+. (C) MSTs of the analyzed isolates based on SeqSphere+ (left) and NanoCore (right); clusters of closely related isolates, computed independently based on the output of SeqSphere+ and NanoCore, are shown as red, blue, and yellow circles. Dashed lines indicate a genetic distance of 0 alleles between the connected isolates; non-dashed lines are annotated with the specific genetic distance between the connected isolates.

