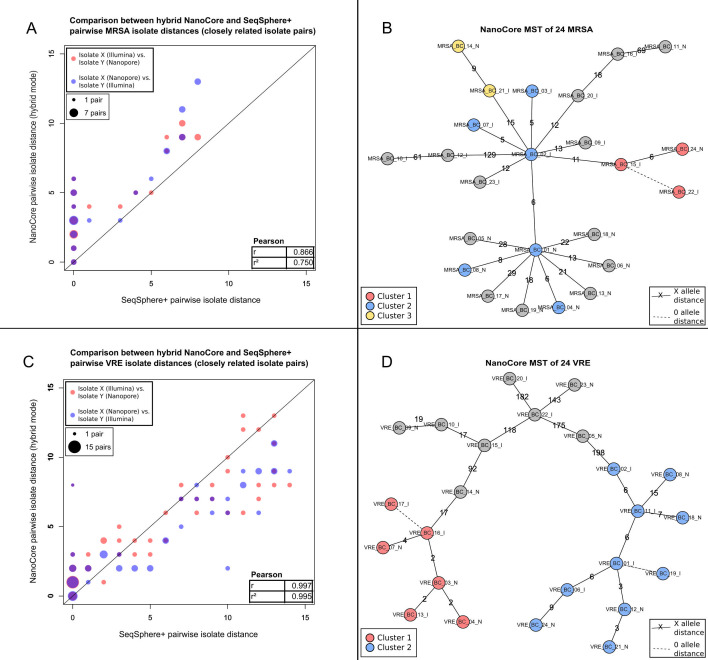
Fig 4.
Evaluation of the “hybrid” mode of NanoCore on MRSA and VRE. (A) Comparison of “hybrid” NanoCore and SeqSphere+ pairwise isolate distances for pairs of closely related MRSA isolates (SeqSphere+ distance ≤ 15), with Pearson correlation shown in the inset. Point sizes are scaled according to the number of pairwise distances with identical coordinates. (B) NanoCore “hybrid” mode minimum spanning tree of the analyzed MRSA isolates, based on the first “hybrid” MRSA scenario (comprising 12 isolates for which only Nanopore data were used and 12 isolates for which only Illumina data were used; see Results); clusters of closely related isolates are shown as red, blue, and yellow circles. Dashed lines indicate a genetic distance of 0 alleles between the connected isolates; non-dashed lines are annotated with the specific genetic distance between the connected isolates. (C) Comparison of “hybrid” NanoCore- and SeqSphere+-based pairwise isolate distances for pairs of closely related VRE isolates (SeqSphere+ distance ≤ 15), with Pearson correlation shown in the inset. Point sizes are scaled according to the number of pairwise distances with identical coordinates. (D) NanoCore “hybrid” mode minimum spanning tree of the analyzed VRE isolates, based on the first “hybrid” VRE scenario (comprising 12 isolates for which only Nanopore data were used and 12 isolates for which only Illumina data were used; see Results); clusters of closely related isolates are shown as red and blue circles. Dashed lines indicate a genetic distance of 0 alleles between the connected isolates; non-dashed lines are annotated with the specific genetic distance between the connected isolates.

