. 2024 Nov 14;14(11):e085234. doi: 10.1136/bmjopen-2024-085234

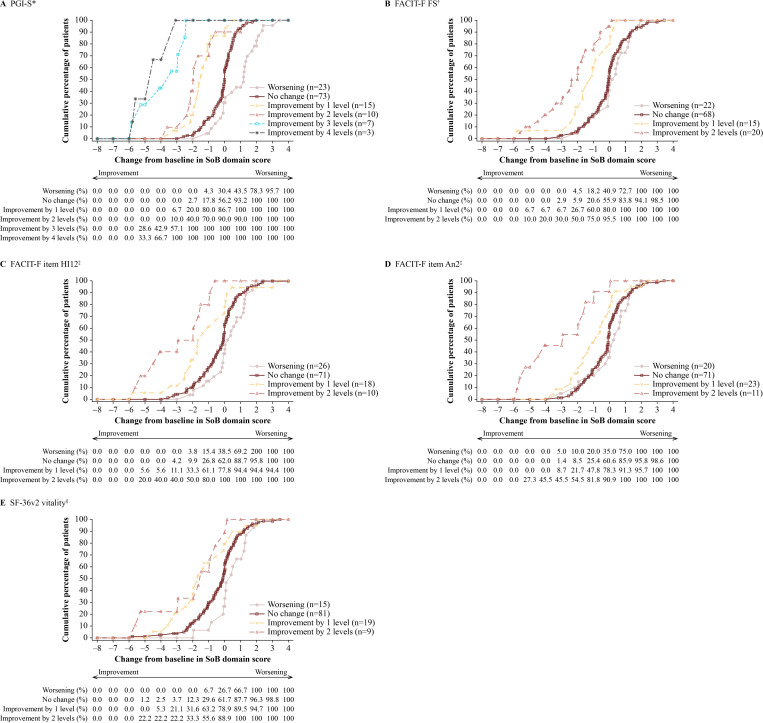
Figure 2. eCDF curves of changes in NTDT-PRO SoB domain scores from baseline to weeks 13–24 by level of response on different anchors. *For the PGI-S, worsening, no change, improvement by 1 level, by 2 levels, by 3 levels and by ≥4 levels were defined as a change of ≥1, >−1 to <1, >−2 to ≤−1, >−3 to ≤−2, >−4 to ≤−3 and ≤−4 points, respectively. †For the FACIT-F FS, worsening, no change, improvement by 1 level and by 2 levels were defined as a change of ≤−4, >−4 to <4, ≥4 to <8 and ≥8 points, respectively. ‡For FACIT-F items HI12 and An2, worsening, no change, improvement by 1 level and by 2 levels were defined as a change of ≤−1, >−1 to <1, ≥1 to <2 and ≥2 to <3 points, respectively. §For SF-36v2 vitality, worsening, no change, improvement by 1 level and by 2 levels were defined as a change of ≤−6.7, >−6.7 to <6.7, ≥6.7 to <13.4 and ≥13.4 points, respectively. eCDF, empirical cumulative distribution function; FACIT-F, Functional Assessment of Chronic Illness Therapy–Fatigue; FS, Fatigue Subscale; NTDT-PRO, non-transfusion-dependent beta-thalassaemia patient-reported outcome; PGI-S, Patient Global Impression of Severity; SF-36v2, Short Form Health Survey version 2; SoB, shortness of breath.

Figure 2