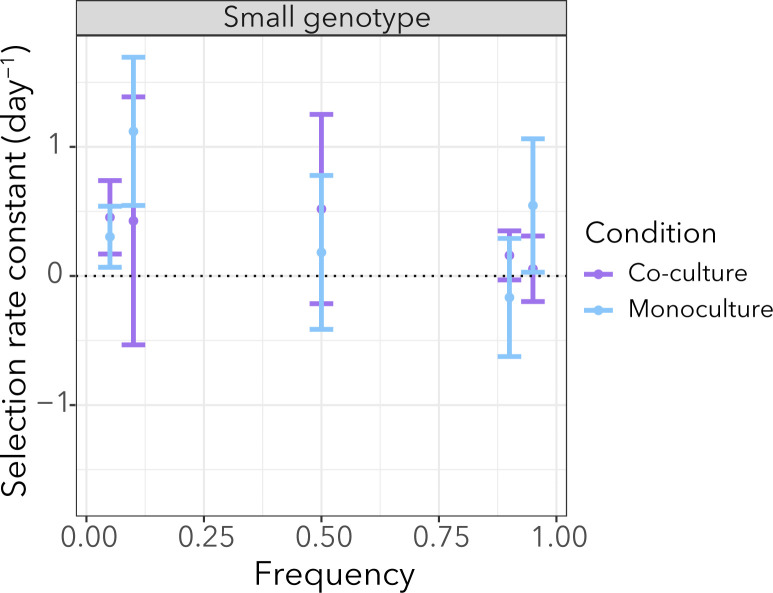
Fig 6.
The relative growth rate of the small genotype was not affected by growth conditions (monoculture or co-culture). Each point shows the average of the selection rate constant and the error bars represent the standard error from six replicates. Despite a tendency for the small genotype to have a fitness advantage over the fleQ genotype (i.e., positive selection rate constant), the values were not significantly different from 0 (Table S2).

