. 2024 Nov 18;15(47):20002–20012. doi: 10.1039/d4sc07028c

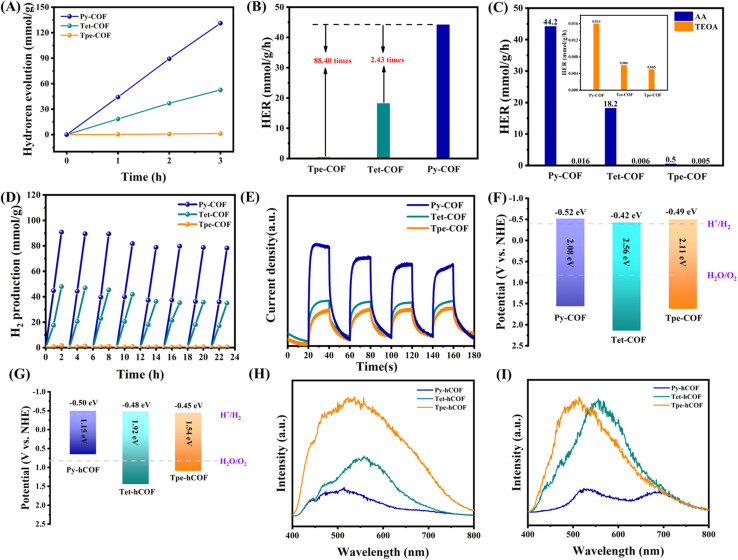
Fig. 3. (A) Time profiles of photocatalytic hydrogen generation of COFs. (B) Average hydrogen evolution rate. (C) Comparison of the hydrogen evolution activity of different sacrificial agents, inset: amplification of the hydrogen evolution activity comparison of triethanolamine. (D) Cyclic H2 evolution over Py-COF, Tet-COF, and Tpe-COF. (E) Transient photocurrent spectra of the COFs. (F) The band diagram of COFs. (G) The band diagram of the three hCOFs. (H) Low-temperature steady-state fluorescence spectra for Py-hCOF, Tet-hCOF, and Tpe-hCOF. (I) Low-temperature steady-state phosphorescence was recorded at a delayed time of 10 μs for Py-hCOF, Tet-hCOF, and Tpe-hCOF.

Fig. 3