. 2024 Oct 28;15(46):19375–19389. doi: 10.1039/d4sc05598e

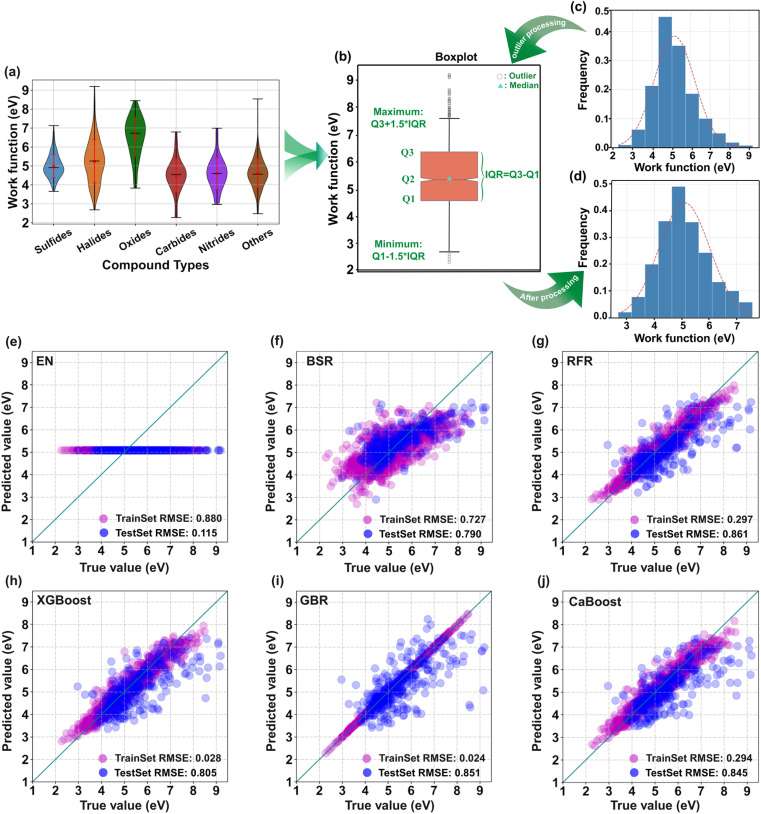
Fig. 2. (a) Work function violin plots of different types of 2D compounds. The black horizontal lines in the middle and at the ends represent the median and extreme values, respectively. The red dots in the middle and the length of the vertical red line represent the mean and variance, respectively. (b) Box plots for outlier processing. Statistical histograms of the work function values (c) before and (d) after outlier processing. (e) Elastic net regression (EN), (f) Bayesian regression (BSR), (g) random forest regression (RFR), (h) XGBoost, (i) gradient boosting regression (GBR), and (j) category boosting (CatBoost) scatter plots of the fitting effects for the 29 descriptors and work function values; TrainSetRMSE and TestSetRMSE are the RMSE values of the models on the training and test sets, respectively.

Fig. 2