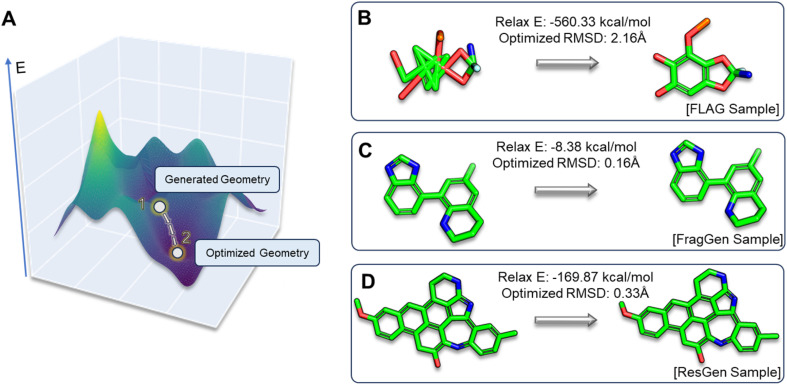
Fig. 6. (A). Visualization depicting the positions of generated and optimized geometries within the energy landscape. (B–D). Three case studies showcasing Relax E and OptRMSD metrics, each illustrating distinct scenarios encountered in FLAG, FragGen, and ResGen.

