
Figure 1.
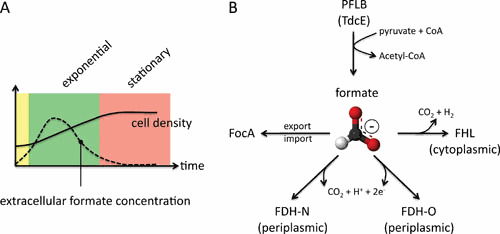
A, Schematic illustration of the increase in cell density (black line) during fermentative growth (green = exponential growth phase, red = stationary growth phase) and the formate concentration in the medium at the same time (dashed line). The curves are based on reference 299. B, Representation of the main metabolic pathways competing for the degradation of formate under different conditions. See the text for details.