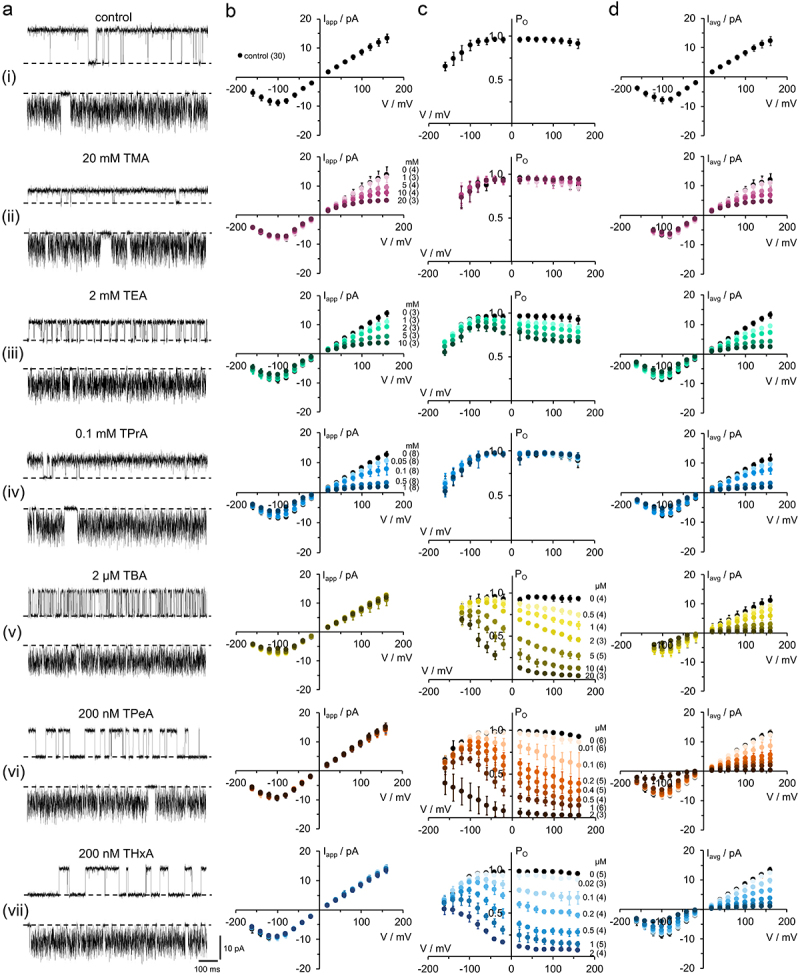
Figure 3.

Blocking properties of KcvNTS by cytosolic QAs. (a) Single-channel fluctuations in DPhPC bilayers in symmetric 100 mM KCl without and with different QAs recorded at +120 mV (upper traces) and −120 mV (lower traces). The closed channel is indicated by a dashed line. The blocker concentrations are given above the traces. (b) Apparent single-channel channel Iapp/V-relations without (black) and with (colored) blocker, concentrations indicated at the curves in either (b) or (c). (c) Apparent open probabilities and (d) time averaged Iavg/V relations with Iavg = Iapp·P0. Mean ± s.D., number of independent recordings is indicated in brackets.
