
Figure 4.
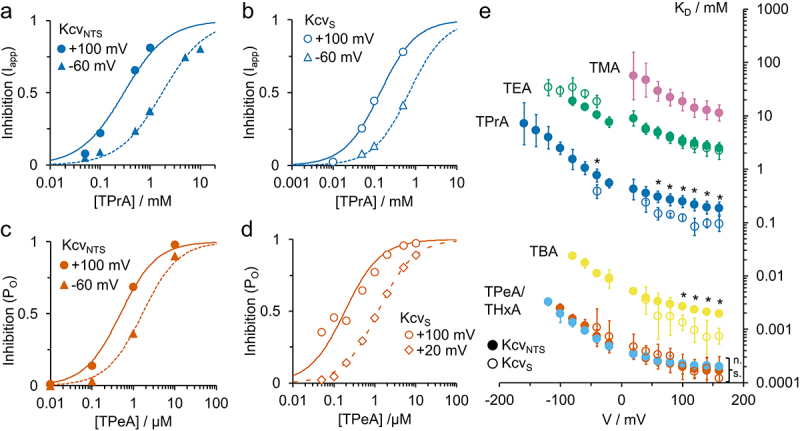
Representative concentration response curves of inhibition Inhexp for (a,b) TPrA (9 Å diameter) and (c,d) TPeA (10.5 Å) in (a,c) KcvNTS and in (b,d) KcvS as obtained from the data in Figure 3 and Figure S2, respectively. Fit with Eq. 5. (e) Voltage dependence of apparent KD (as obtained from fits like those in Figure 4a–d) for the different blockers in KcvNTS (filled circles) and KcvS (open circles). TMA: purple, TEA: green, TPrA: dark blue, TBA: yellow, TPeA: light blue, THxA: orange. *: At these voltages, the KD for TPrA and TBA differ significantly from each other in KcvNTS and KcvS. “n.s.:” The KD for TPeA (KcvNTS and KcvS) and TPeA (KcvNTS) do not differ significantly at any voltage. One-parameter ANOVA with threshold p = 0.05.