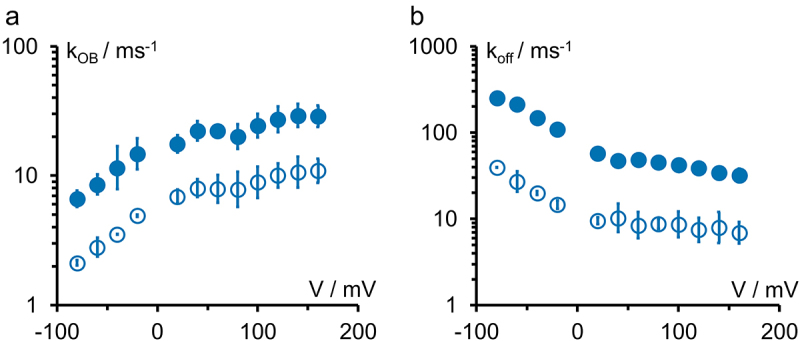
Figure 5.

Kinetics of the open-state block with TPrA for the two channel isoforms KcvNTS (filled symbols, no cytosolic gate) and KcvS open symbols, with cytosolic gate) (Figure 2a,c). (a) Rate constant kOB of blocker binding and (b) rate constant kBO = koff of blocker release for 0.1 mM cytosolic TPrA. Averages ± sd of three experiments each. The small errors are a typical benefit of Kcv channels.
