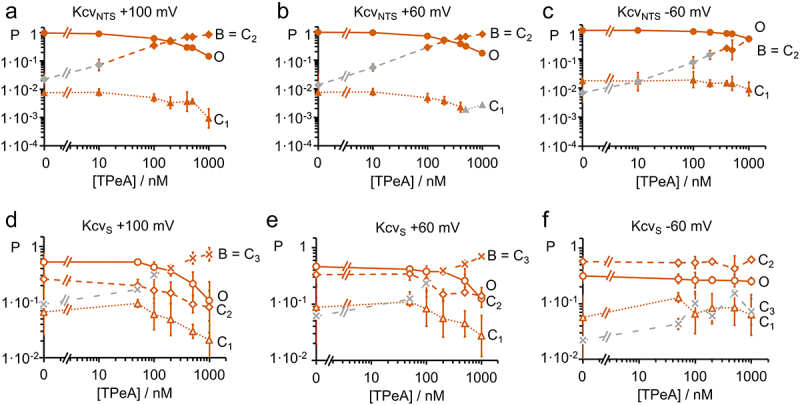
Figure 7.

Dependence of occupation probabilities P of the states in the Markov models of Figure 1e or f on TPeA concentration. Association of the blocked state B to C2 (diamonds in (a-c)) or C3 (crosses in (d-f) is based on the dependence of their occupation probabilities on blocker concentration. The occupation probabilities of the open state (PO, circles) and of the two or three closed states (PC1, triangles, PC2, diamonds, and PC3, crosses) are shown for (a,b,c) KcvNTS (filled symbols) and for (d,e,f) KcvS (open symbols) at different TPeA concentrations at (a,d) +100 mV, (b,e) +60 mV and (c,f) −60 mV. Averages ± sd of three experiments each. Orange symbols in the curves related to B mark the concentrations, where the occupation probability of the respective state exceeds 10 times that of the control value and are therefore dominated by B. Grey symbols indicate that this probability is too small for the identification of B. for KcvS at −60 mV, and for both channels at −100 mV (not shown), this threshold was not reached (only gray symbols). The two additional gray triangles in B are data points, where due to the low probability of C1, n = 3 could not be achieved for this state. This did not affect the determination of C2.
