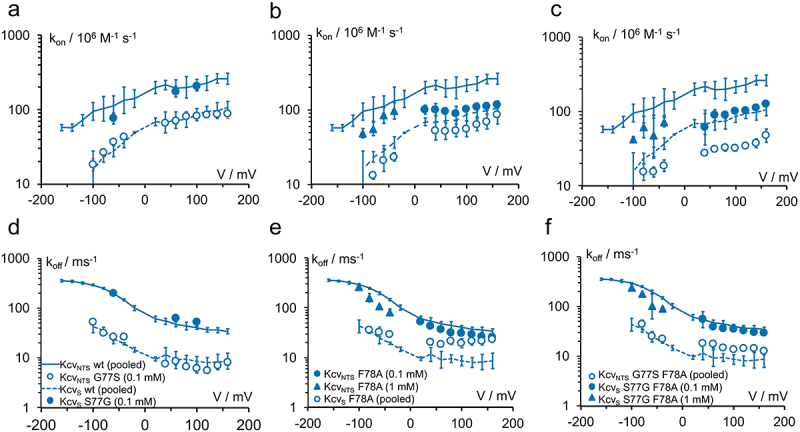
Figure 11.

Block by TPrA. Influence of the residues at positions 77 and 78 on the rate constants of (a, b, c) blocker binding kon = kOB/[TPrA] and (d,e,f) release (kBO = koff) in different mutants of KcvNTS and of KcvS. Lines show the wild-type data (KcvNTS: continuous, KcvS: dashed), the symbols indicate the residue at locations 77: G = filled, S = open for the mutants (a,d) S77G and G77S (b,e) F78A and (c,f) the double mutants. “pooled:” wt data averaged over TPrA concentration from 0.05 – 5 mM (KcvNTS) and 0.1 – 1 mM (KcvS), data for KcvNTS S77G F78A averaged over 0.1 & 1 mM. All other blocker concentrations are indicated in the legends. All data points: mean ± sd of at least three experiments each. Because of the decrease of the signal with higher negative voltages, rate constants could not be determined from fitting amplitude histograms for voltages more negative than −80 mV or −60 mV for all mutants and KcvS.
