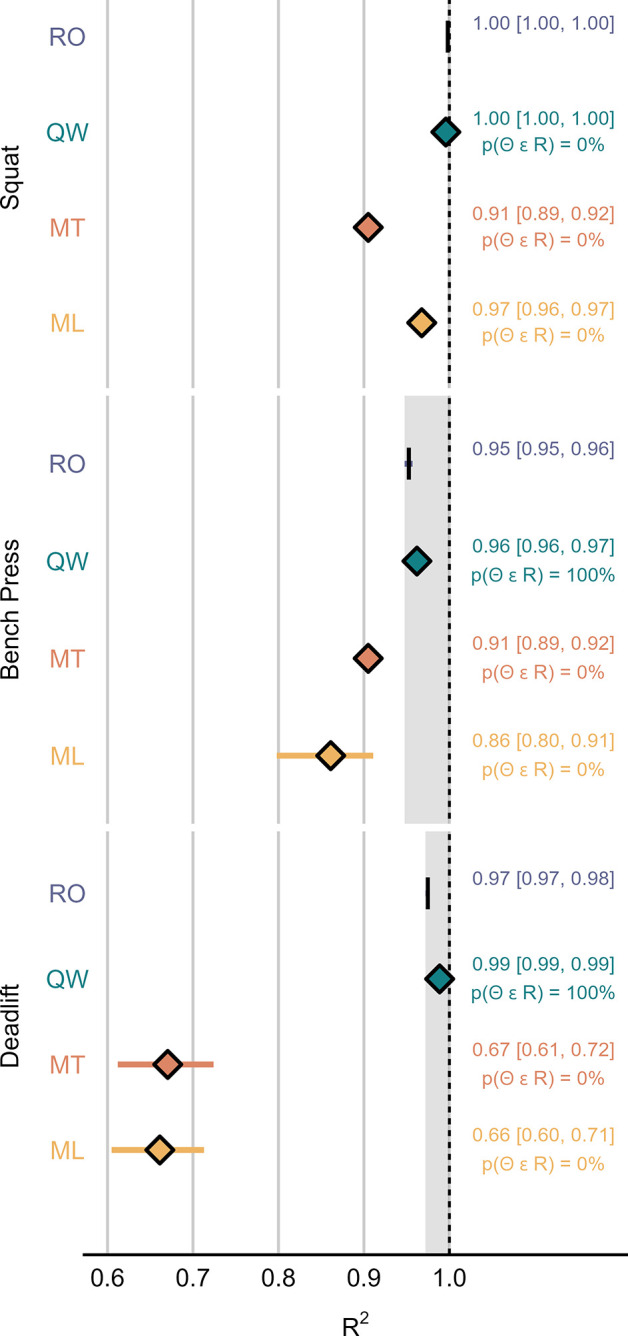
Fig 5. Coefficient of determination (R2) of model 1.

The mean and 95% HDI of the posterior distribution for each device are summarized numerically to the right-hand side of the plot. Shaded areas mark the region of practical equivalence defined by the 95% Highest Density Interval (HDI) of RepOne. p(Θ ϵ R), probability of the parameter falling into the region of practical equivalence; ML, MyLift; MT, Metric VBT; QW, Qwik VBT; RO, RepOne.
