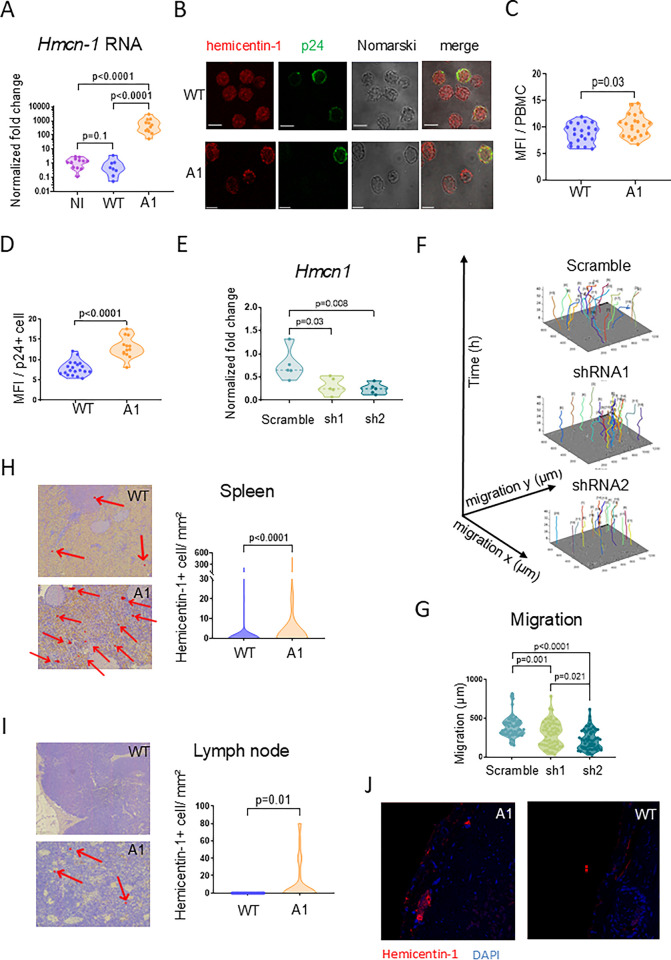
Fig 4. HMCN-1/hemicentin-1 is upregulated in peripheral B-cells, lymph nodes and spleen of A1-infected sheep.
(A) RT-qPCR quantification of Hmcn-1 RNA in PBMCs collected at day 811 post-injection. Relative quantification was performed by the ΔΔCT method using ß-actin as reference [78]. Data resulting from three independent experiments were normalized to the means of WT samples, arbitrarily set to 1. p-values were calculated according to the two-tailed Wilcoxon signed rank test. (B) Expression of hemicentin-1 protein in ex-vivo cultures of BLV-infected PBMCs. Hemicentin-1 was labelled with the HPA051677 rabbit antiserum and an AlexaFluor 647 secondary antibody (in red). The p24 capsid protein was revealed by the 4’G9 monoclonal antibody and an AlexaFluor 488 conjugate (p24 in green). Scale bars indicate 5 μm. (C) Quantification of the mean fluorescence intensity (MFI) of hemicentin-1 in PBMCs from sheep #2130 (WT) and #0522 (A1) measured using the ZEN Blue software (n = 30 cells). (D) MFI of hemicentin-1 in cells expressing the p24 protein. (E) The OVK cell line was transduced with lentivectors encoding two Hmcn-1 shRNAs (sh1, sh2) or a scrambled control. Hmcn-1 RNA levels in transduced cell lines were quantified by RT-qPCR. Relative quantification was performed by the ΔΔCT method using ß-actin as reference [78]. Data resulting from five independent experiments were normalized to mock OVK cells, arbitrarily set to 1. p-values were calculated according to the Mann-Whitney test. (F) OVK cells transduced with lentivectors encoding scrambled/sh1/sh2 shRNAs were recorded for 48 hours using the Incucyte live-cell imaging system. Tracking plots of cell migration over time (in μm) of 20 individual cells identified manually by the Celltracker and modelized with the Matlab software. (G) Migration distances covered by 60 individual cells during the culture as measured with Celltracker. (H) Representative immunohistochemistry of hemicentin-1 in spleen biopsies collected from sheep #2130 (WT) and #0522 (A1). The numbers of hemicentin-1+ cells per mm2 of spleen tissue. p-values were calculated according to Mann-Whitney tests. (I) Hemicentin-1 immunohistochemistry in lymph node biopsies isolated from sheep #2130 (WT) and #0522 (A1). Enumeration of hemicentin-1+ cells per mm2 of spleen tissue. p-values were calculated according to Mann-Whitney tests. (J) Spleen sections from WT and A1-infected sheep were stained with DAPI (nuclei in blue) and labelled with anti-HMCN1 antibody combined with an AlexaFluor 647 conjugate (in red). Slides were imaged with a Stellaris confocal microscope (Leica).

