
Figure 1.
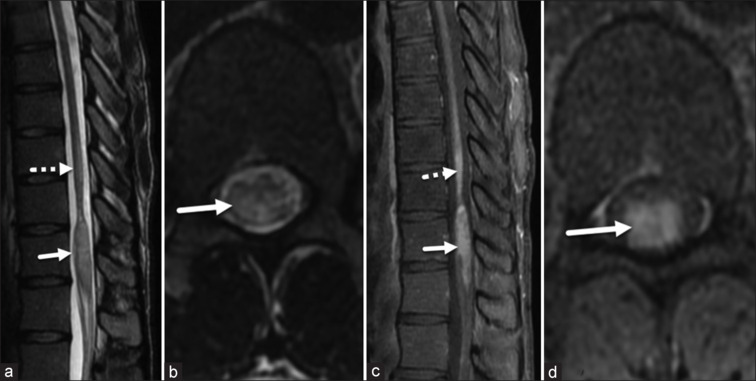
Sagittal (a) and axial (b) T2-WIs demonstrate a partial reduction in the previous expansion and T2 hyperintensity of the spinal cord (dotted arrow in a), alongside persistent enhancement (dotted arrow in c) at the D10–D11 level. In addition, the conus at the D12–L1 level shows expansion, T2 hyperintensity (arrows in a, b), and enhancement (arrows in c, d)
T2-WIs: T2-weighted images