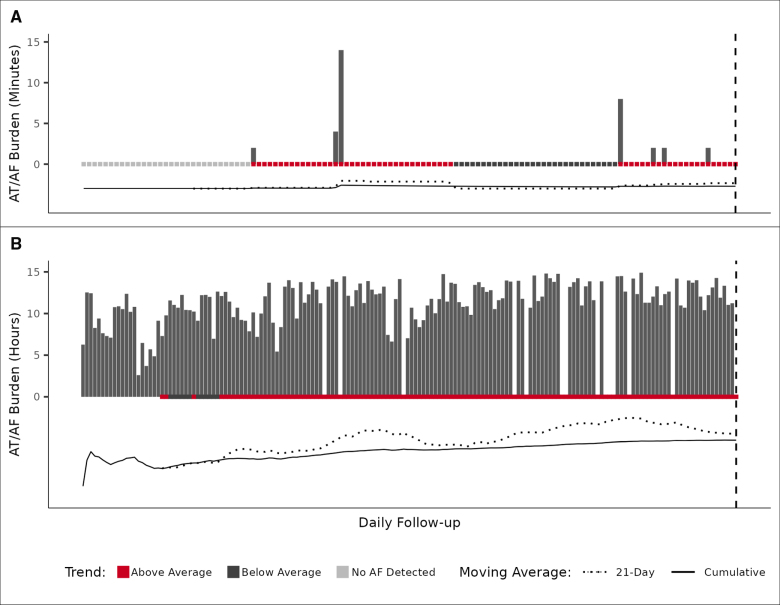
Figure 2.
Atrial tachycardia (AT)/atrial fibrillation (AF) burden temporal trends. The comparison of a 21-day simple moving average (SMA) with its cumulative moving average (CMA) shows when the daily AT/AF burden amount is above or below average. The onset of relative risk occurs when the SMA crosses above the CMA, remains elevated when the SMA is greater than the CMA, and ends when the SMA crosses below the CMA. The trend is sensitive to a relative increase in daily AT/AF burden (A) and longer periods of increasing burden (B). The patients in both examples experienced an ischemic stroke on the last day of follow-up; follow-up dates were different for each example.

