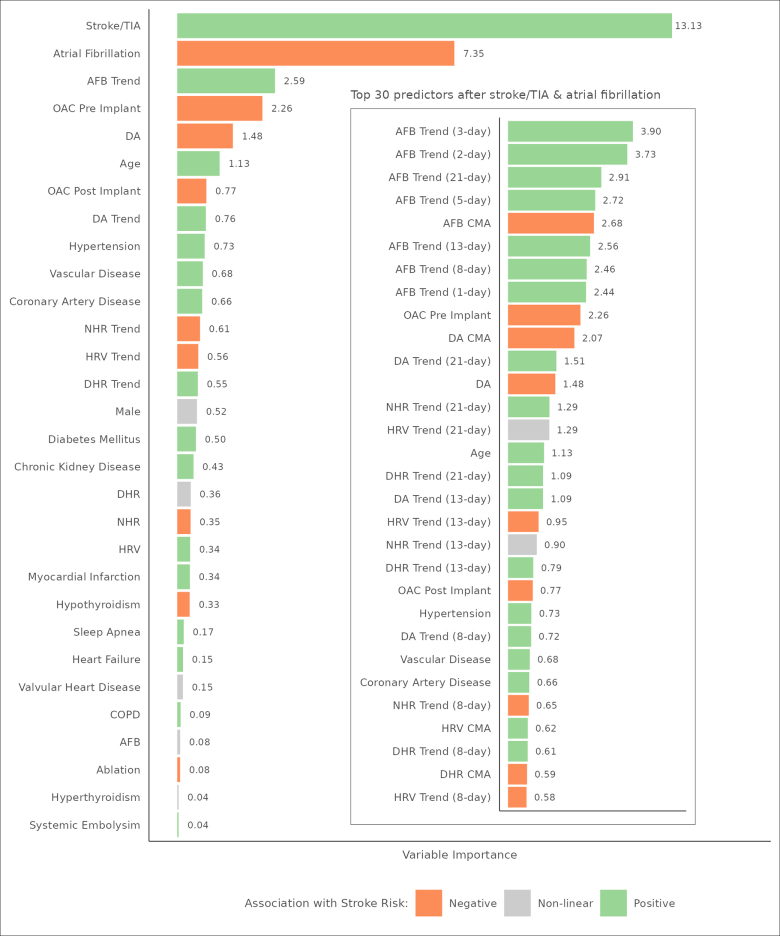
Figure 3.
Mean variable importance by feature. This figure provides a bar plot of mean variable importance, scaled as a percent of total variable importance, and a color-coded association with stroke risk for each feature in the analysis. For ease of presentation, device parameters show aggregate variable importance across all their respective features. The inset presents the top 30 individual features after stroke/transient ischemic attack (TIA) and history of atrial fibrillation (AF) that were selected as predictors. All trends are defined as the p-day simple moving average offset by its cumulative moving average. AFB indicates atrial fibrillation burden; COPD, chronic obstructive pulmonary disease; DA, daily activity; DHR, daytime heart rate; HRV, heart rate variability; NHR, nighttime heart rate; and OAC, oral anticoagulation.

