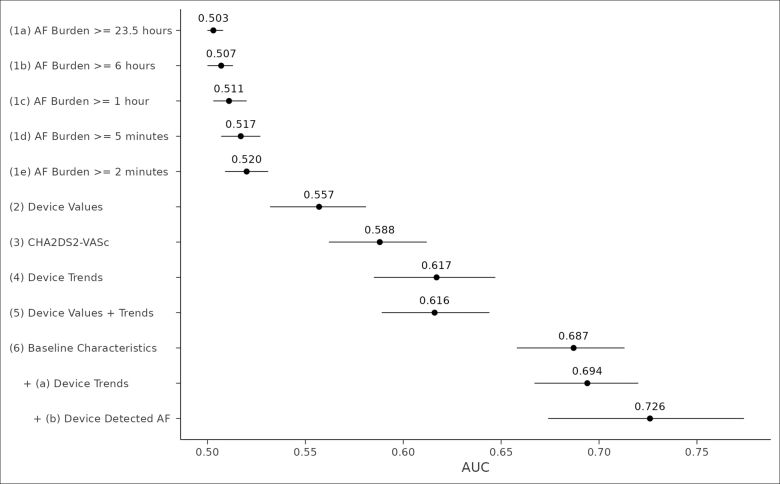
Figure 5.
Mean area under the receiver operating characteristic curve (AUC) by model structure. This error bar plot shows the mean AUC and 95% credible interval from 1000 bootstrapped, hold-out validation samples for 12 different model structures. Device values indicate the raw device parameter data for atrial tachycardia (AT)/atrial fibrillation (AF) burden, patient activity, daytime heart rate, nighttime heart rate, and heart rate variability; device trends; the temporal trends of the device parameter data; CHA2DS2-Vasc, the eponymous score assessed via claims based on the patient’s clinical history before device implantation; and baseline characteristics, all comorbidities assessed via claims based on the patient’s clinical history before device implantation. Model 6a adds its respective features to the preceding model structure. Model 6b is the same model structure as model 6a and fits with a subset of patients identified as having at least 1 day during follow-up with an AT/AF burden amount of >0.

