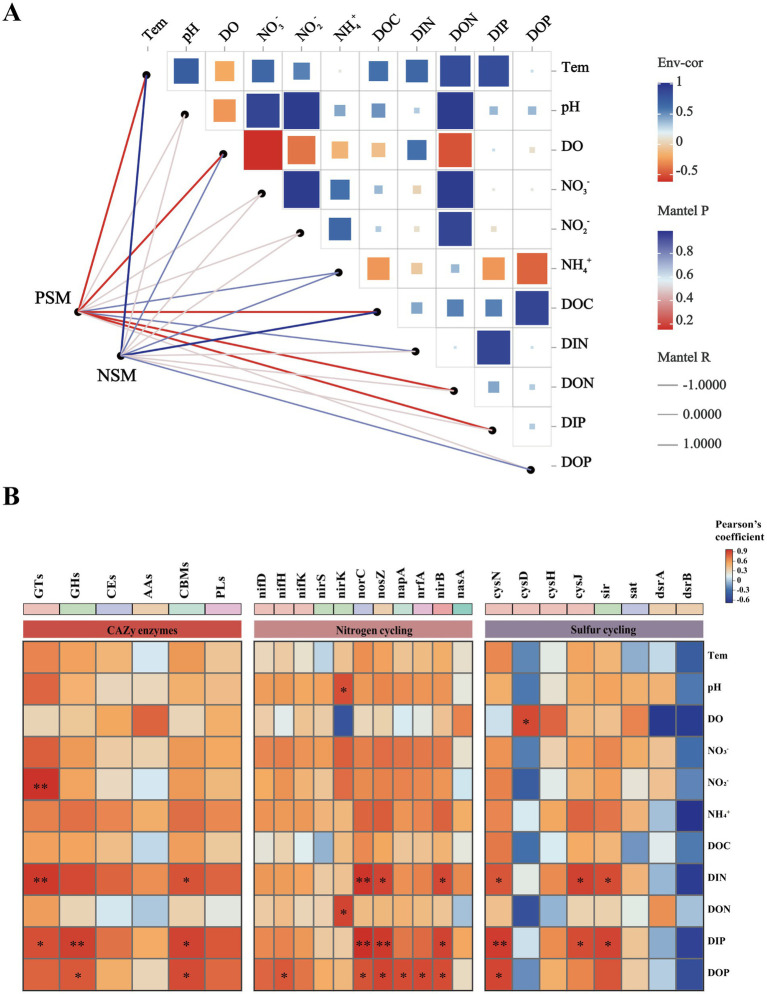
Figure 6.
Correlation heatmaps between environmental factors and the microbial community (A), functional enzymes and genes (B). The size and shade of each square are proportional to the degree of correlation. PSM represents phycospheric seawater microorganisms, and NSM represents nonalgae-covered seawater microorganisms. p < 0.05 *, p < 0.01 **.

