
FIGURE 3.
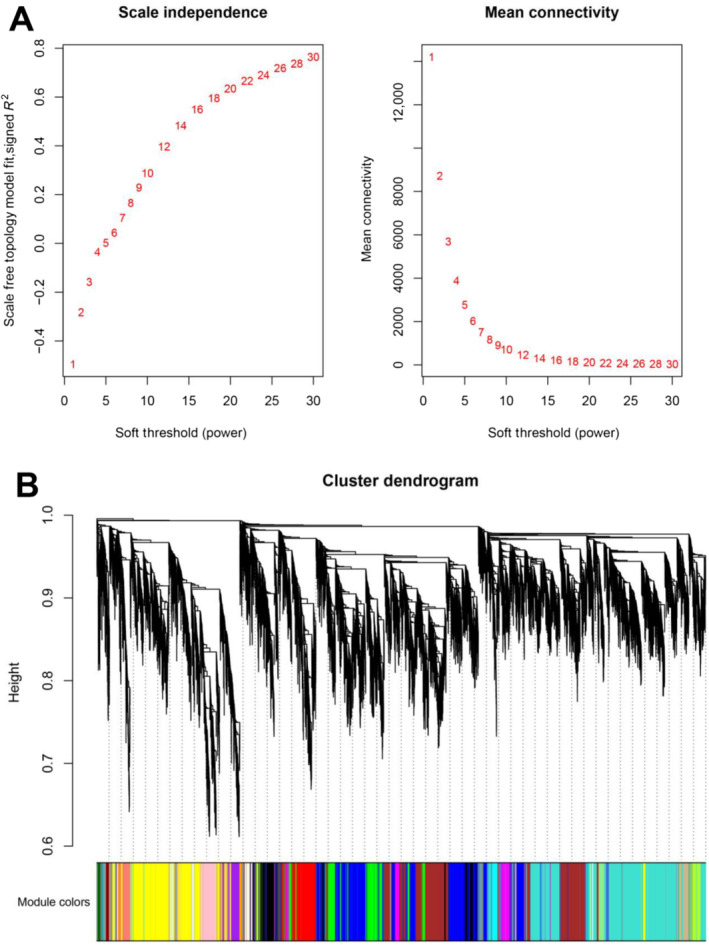
Soft‐threshold determination of gene co‐expression networks and module detection. (A) Determination of the soft threshold for dividing different modules. (B) Determination of the Hierarchical clustering tree. Each color represents a module in the co‐expression network by WGCNA.