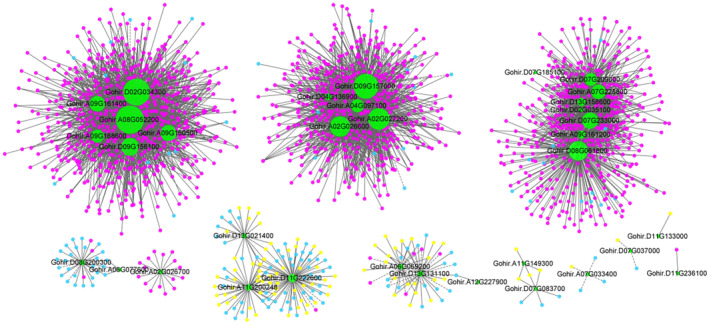
FIGURE 4.

Correlation between structural genes and regulatory genes in different co‐expression networks. Green node: Structural gene; red node: Regulatory gene with up‐regulated expression under UV‐B stress; yellow node: Regulatory gene with down‐regulated expression under UV‐B stress; blue node: Regulatory gene with no significant difference in expression under UV‐B stress. Solid line: Positive regulation; dash line: Negative regulation.
