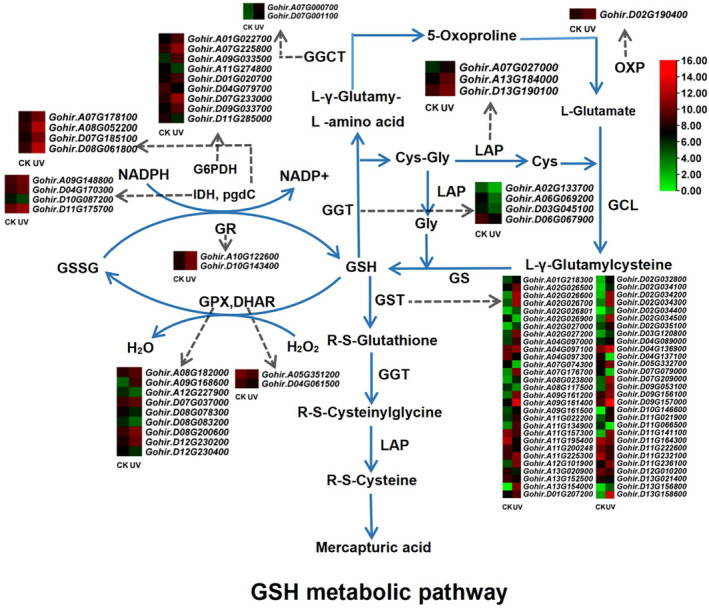
FIGURE 6.

Pathway diagram and expression heat map of structural and regulatory genes related to the GSH metabolism. Pathway diagram shows 12 key enzymes in the GSH metabolic pathway; heat map shows structural genes with significantly differential expression under UV‐B stress.
