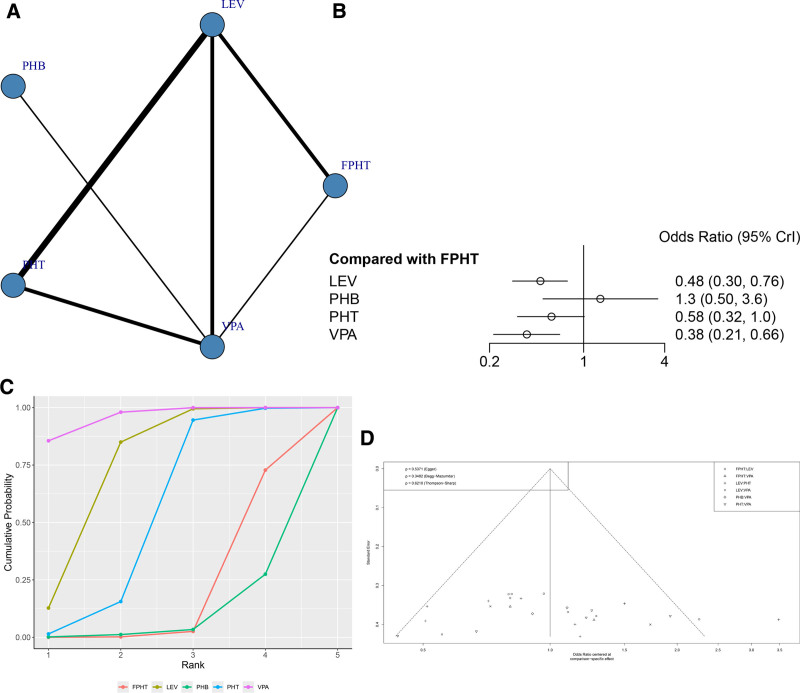
Figure 7.
(A) Network structure diagrams of the incidence of AEs. (B) Forest plot of the incidence of AEs as compared with FPHT. (C) SUCRA probabilities of different treatments for the incidence of AEs. (D) Funnel plot of the different treatments for the incidence of AEs. AEs = adverse events, FPHT = fosphenytoin, SURCA = surface under the cumulative ranking curve.

