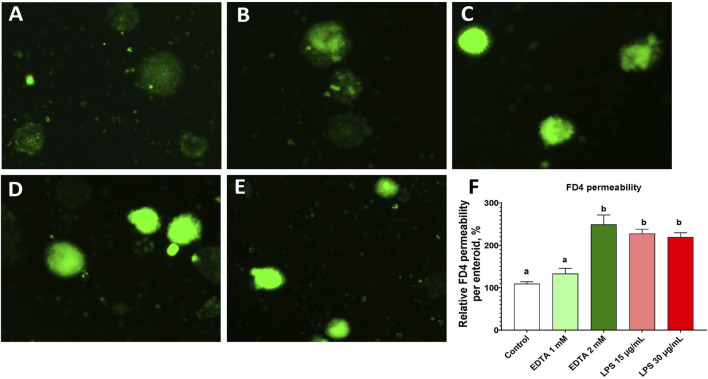
FIGURE 6.
Evaluation of FD4 permeability in enteroids at d4 in culture. (A ∼ E) FD4 fluorescence retention in the enteroids pretreated with PBS control (A), EDTA 1 mM (B), EDTA 2 mM (C), LPS 15 μg/mL (D), and LPS 30 μg/mL (E). (F) Normalized FD4 permeability relative to the PBS control. Data are presented as the mean ± SEM from at least six replicate wells. Different letters indicate P ≦ 0.05 among treatments.

