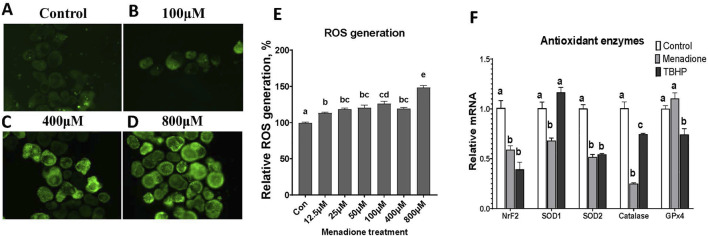
FIGURE 8.
Evaluation of enteroids in response to oxidative challenge at d4 in culture. (A–D) ROS generation in enteroids pretreated with DMSO control, 100 μM, 400 μM, and 800 µM menadione, respectively. (E) Relative ROS quantification to the control. (F) Gene expression in enteroids pretreated with DMSO control, 400 µM menadione, or TBHP. Data are presented as the mean ± SEM from at least six replicate wells. Different letters indicate P ≦ 0.05 among treatments.

