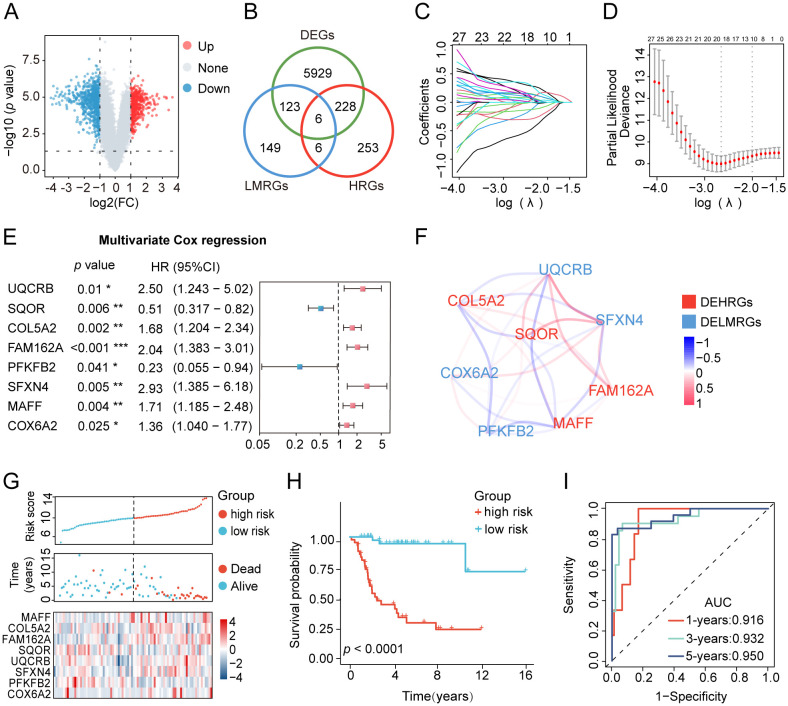
Figure 2.
Development of the HLMRGS and verification of its predictive ability in the TARGET database. (A) Volcano chart of 6286 DEGs between osteosarcoma and normal samples. (B) Venn diagram depicting the junction of HRGs, LRGs, and DEGs. (C, D) LASSO penalized Cox regression, and (E) multivariate Cox regression analyses of the DEHRGs and DELMRGs. (F) The association network diagram and types of 8 HLMRGs. (G) The risk scores, clinical outcomes, and expression of 8 modeled genes of osteosarcoma samples divided by median risk score. (H) KM survival analysis for the two risk cohorts. (I) The ROC curve of HLMRGS at 1, 3, 5 years.

