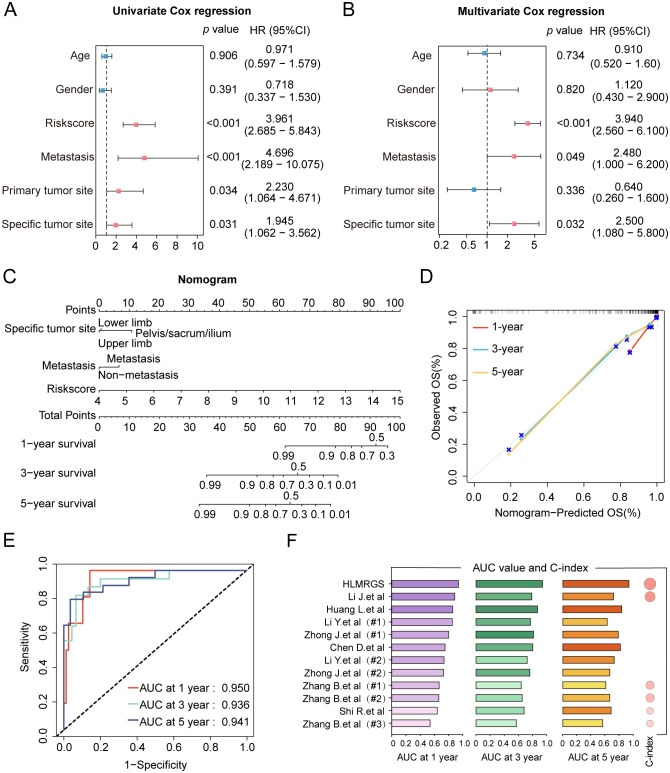
Figure 3.
Construction of the clinical nomogram and validation of its predictive power in the TARGET database. (A, B) The forest diagram of univariate and multivariate Cox regression analyses comprising risk scores and distinctive clinical features. (C) The nomogram based on three factors with statistical significance, involving metastasis, specific tumor site and risk scores. Total scores were summed up by points of each variable. The survival probabilities in three different time periods are indicated on the axis at the bottom. (D) Calibration curves showing a tremendous fit between the predictive outcomes and actual outcomes. (E) ROC curves of the nomogram depicting the prognostic performance of HLMRGS. (F) Comparison of AUC values and C-index between the HLMRGS and other gene signatures related with hypoxia or lactate metabolism.

