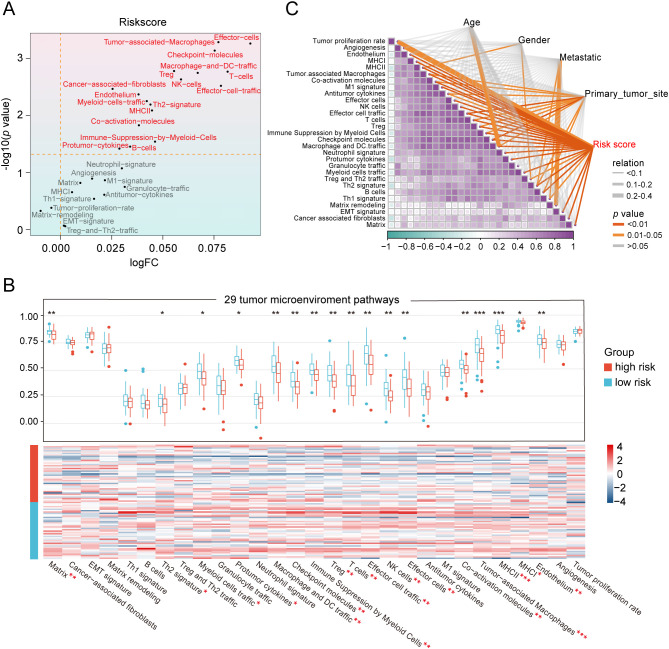
Figure 4.
Heterogeneity of the tumor microenvironment between the two risk groups in the TARGET database. (A) The differentially expressed activity of 29 TME pathways between the two subgroups using “limma” package. (B) Heatmap and box line plot depicting the activity discrepancies of 29 TME pathways between the two cohorts. (C) Multidimensional correlation plot demonstrating the relationship of 29 TME pathways, and risk score as well as other clinical features. ∗ p < 0.05, ∗∗ p < 0.01, ∗∗∗ p < 0.001.

