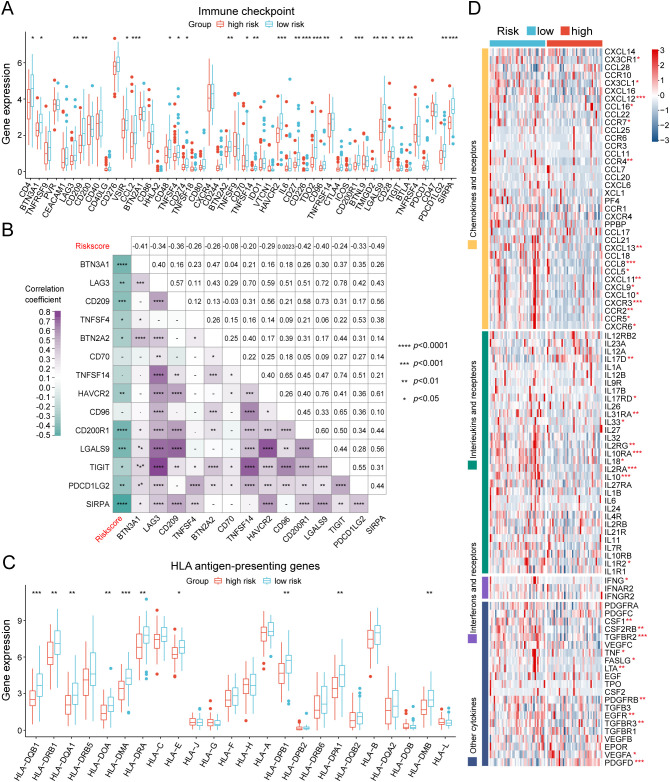
Figure 6.
Evaluation of immunotherapy response of the low- and high-risk groups in the TARGET database. (A) Box plot showing the expression variations in immune checkpoints between the two cohorts. (B) Multidimensional correlation plot illustrating the relationship of risk scores and the gene expression of immune checkpoints reaching statistically significant differences in both the TARGET and GSE21257 cohorts. (C) Expression divergences of MHC molecules of the two subgroups. (D) Heatmap illustrating the differences in the gene expression of chemokines, interleukins, interferons, receptors, and other cytokines between the two risk groups. ∗ p < 0.05, ∗∗ p < 0.01, ∗∗∗ p < 0.001, ∗∗∗∗ p < 0.0001.

