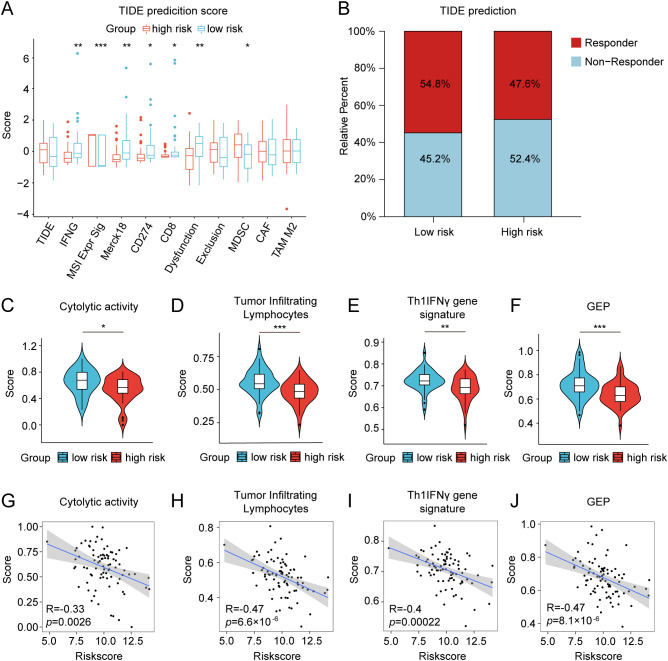
Figure 7.
Differences in TIDE prediction and pathway activities of immunotherapy-related pathways between the low- and high-risk groups in the TARGET database. (A) TIDE prediction of the immunotherapy effectiveness of the two cohorts. (B) The bar graph depicting the proportion of patients sensitive and resistant to immunotherapy. (C–F) Violin plots presenting the distinctions of cytolytic activity score, tumor infiltrating lymphocyte score, Th1/IFN gene signature score, and T-cell-inflamed gene expression profile (GEP) score. (G–J) Correlation analysis between the risk score and the four scores mentioned above. ∗ p < 0.05, ∗∗ p < 0.01, ∗∗∗ p < 0.001.

