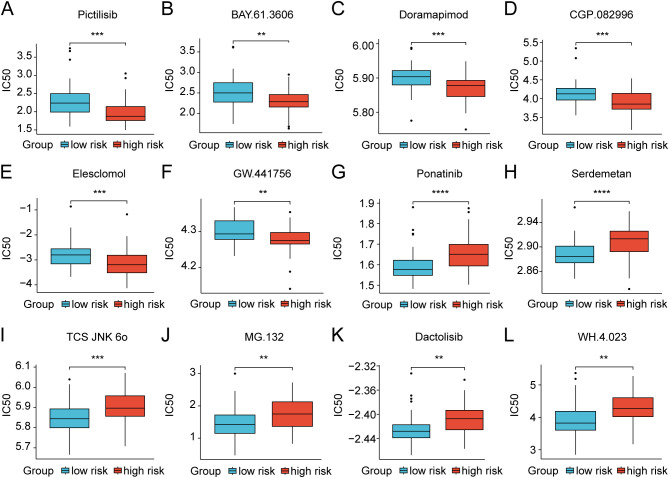
Figure 8.
Discrepancies in treatment response to chemotherapy drugs of osteosarcoma patients between the low- and high-risk groups in the TARGET dataset. (A–L) Box plots showing the IC50 values for clinical drugs with statistical significance amidst the two risk groups. ** p < 0.01, *** p < 0.001, **** p < 0.0001.

